# What is DataLab?
DataLab is a data notebook that (1) smartly leverages generative AI technology so you can ‘chat with your data’, (2) features a powerful IDE to review, tweak and run your analysis, and (3) seamlessly turns your work into a beautiful, shareable report.
Every DataLab workbook runs in a fully-managed, cloud-hosted environment with R / Python, built-in support for SQL and all commonly used data science packages pre-installed. If you need more, you can easily install additional packages. Learn more in [Working with packages](/work/code-cell/packages).
DataLab makes connecting to external databases a breeze. Set up the connection once and access data in any workbook. Write your query in a SQL cell; the result will be available as a data frame so you can continue your analysis. Learn more in [SQL cell](/work/sql-cell).
DataLab makes collaboration seamless. You can invite people through email or share a link. They can now jump in and edit or comment on your work in real-time. Learn more in [Sharing a workbook](/work/sharing-a-workbook).
DataLab features a powerful AI Assistant to chat with your data, or to generate and edit code, as well as fix and explain mistakes. The assistant helps you go from data to insights faster, building more skill in the process. Learn more in [AI Assistant](/work/ai-assistant).
With the chart cell, you can create a beautiful chart of any data frame without code. Super-useful for quick data exploration and for creating sleek visuals to share with your peers. Learn more in [Chart cell](/work/chart-cell).
## Getting started
You can create up to 3 DataLab workbooks for free; all you need is a DataCamp account. Head over to to experience the future of data exploration!
# Creating a workbook
A data project in DataLab is called a workbook: a collection of source, data, and configuration files. A workbook typically contains at least one notebook, but can also contain no or multiple notebooks.
## Creating an empty workbook
In the DataLab interface, click the "New workbook" button in the sidebar.
From here on, you can work in the "AI chat" view and start a chat with the AI assistant or switch to the "Code" view and start adding cells to an empty notebook in your workbook, bring in your own datasets, import previous work or start from a template or dataset.
Ways to start in an empty workbook
### **Creating a workbook from a template**
DataLab provides a wide range of **templates** that contain pre-written code to solve common data science tasks, going from simple things like merging two data frames, all the way up to larger problems such as training a decision tree classifier for making predictions.
To create a workbook from a template, click on "Templates" in the left side bar, browse the list, select a template, and click **Create workbook**.
### Creating a workbook from a dataset
In addition to templates, DataCamp provides a rich and growing collection of datasets to analyze; the workbook you create through this way will contain the necessary data files with some sample code to import and it and a brief description so you can dive in immediately.
To create a workbook from a DataCamp dataset, you can click on the **Dataset** in the left side bar, browse the list, select a dataset, and click **Create workbook**.
### **Creating a workbook from a (public) GitHub repository**
Lots of interesting analyses live in GitHub repositories. DataLab allows you to easily create a new workbook from any public GitHub repository.
1. Create a new blank workbook as described [in the section above](#creating-a-blank-python-or-r-workspace) and switch to the "Code" view.
2. Click on the **Import from GitHub** button in the new blank workbook.
3. Enter the URL or repository name in the modal that appears.
4. A new workbook opens up that includes all the files from the specified repository.
### **Make a copy of an existing workbook**
Finally, you can also create a new workbook by making a copy of an already existing workbook that you own or that you have view access to:
1. In the workbook you want to copy, open the **File** menu and select **Make a Copy**:\
2. In the modal that appears specify the title for the new workbook (optional), in which account you would like to create this workbook, whether the new workbook should be private or public, and click **Make a Copy.**
Copy workbook modal
3. A new workbook will be created that contains all the files and folders that are stored in the home directory of the original workbook.
Note that in step 1, you can also click **Create Copy Link** to create a reusable URL to create a new workbook, duplicating the original workbook. You can use this URL to send over to peers so they can easily create a copy of your workbook. This can be useful in an education context, as described in [DataLab for education](/resources/datalab-for-education).
### **Visit `ws.new`**
* Visit the [**`ws.new`**](https://ws.new/) url in your browser
* You land in a new, empty workbook, ready to start working.
## Personal and group workbook
By default, all workbooks you create will live under your personal account. You can see this by checking the account selector in the sidebar.
Workbooks that live in your personal account, also called personal workbooks:
* Can be made public to anyone with the link to your workbook (you can choose to disable this).
* Can use [environment variables](/work/environment-variables) and [database connections](/connect-to-data/connect-your-data-to-workspace) that are configured in your personal account.
If you are a member of one or more DataCamp groups, you can also create workbooks inside these group spaces. To create a group workbook, click the account selector dropdown and select a group. These group workbooks:
* Can easily be shared with **all** members in your group (rather than having to share with every group member individually).
* Can use [environment variables](/work/environment-variables) and [database connections](/connect-to-data/connect-your-data-to-workspace) that are configured in the group.
* Cannot be shared with members that are not in your group.
# Sharing a workbook
DataLab supports real-time collaboration in notebooks (think Google Docs but for data science) and sharing your workbooks with different access rights.
To share a workbook, click the 'Share' button in the nav bar.
Workbook sharing modal
In this modal, you can:
* Invite specific people to your workbook by using their email
* The collaborators you add will receive an email with the link to the workbook.
* Today, you can only invite users that already have a DataCamp account.
* Your workbook will show up on the dashboard of collaborators you add.
* Change the workbook visibility
* **Public**: the workbook is open to the community. Others can find, view and comment on your workbook.
* **Private**: only you and the people you invite have access to the workbook.
* Group workbooks are private by definition, but you can give access to all members in the group that this workbook is part of (see [Creating a workbook](/work/workspaces#personal-and-group-workbook) for more info on group workbooks)
### Roles
You can give different people (or groups of people) different roles:
* **Viewer** - Can read the workbook contents, but cannot make edits, leave comments, execute code or manage sharing settings.
* **Editor** - Can read, edit, and execute workbook contents. Can rename, share and publish the workbook.
* **Owner** (only the project creator) - Can do everything the editor can do, but can also delete the workbook.
# Managing a workbook
### Maximum workbook size
Workbooks have a maximum size limit: the total size of all the files in a workbook cannot exceed 5GB for users on the DataLab Starter plan or 20GB for users on the DataLab Premium plan. This is a per-workbook limit, so free users could have 3 workbooks with 4 GB each, for example.
If the total size of all the files in a single workbooks exceeds the limit, you can no longer edit that workbook: through the file browser, you can remove files from the workbook filesystem to go below the limit again.
### Saving your edits
All your edits are automatically saved. If you close and re-enter the workbook at a later point in time, all your work from before is saved. You can review and restore past versions of your notebooks through [Version history](/work/version-history).
### Renaming a workbook
1. Click on 'File > Rename workbook' in the toolbar.
2. In the modal that appears specify the new workbook name and click "Rename Workbook".
### Changing the workbook language
You can use either **Python (version 3.8 or 3.10)** or **R (version 4.2 or 4.4)** to execute code in your notebooks. The default language of your workbook is guessed based on your previous workbook. If it can't be guessed, you will be asked to specify a language.
To change the programming language yourself, click "Environment > Session Details" and select the programming language in the dropdown.
Note that this will not automatically edit/translate any code that may already exist in notebooks (e.g. you still have to convert a `pd.read_csv()` into `readr::read_csv()` when switching the language from Python to R).
Open up the Session Details
Session details dialog, where you can update the language
#### Python 3.8 versus Python 3.10
Python 3.10 comes with a lot of updated pre-installed packages compared to Python 3.8, most notably Pandas 2.x instead of 1.x. For a list of breaking changes, see the [Pandas docs](https://pandas.pydata.org/docs/dev/whatsnew/v2.0.0.html#backwards-incompatible-api-changes).
### Deleting your workbook
If you wish to permanently delete your workbook click "File > Delete Workbook". Confirm the action.
**Deleting a workbook is irreversible!**
# Code cell
Use a code cell to write, run and inspect code and add it to your notebook.
### Writing code
* Write code like you would do in any other coding environment!
* You will get code suggestions while you type, so you don't have to type long function or variables names in full.
### Running code
To run code:
* Use "Run" in the cell menu or `Ctrl` + `Enter` to run the currently active code cell.
* Use `Shift` + `Enter` to run the currently active code cell and make the next cell in the notebook active.
#### Code cell status
There is a 'stoplight' dot on the top-right hand side of your workbook with different states:

The cell successfully ran, and the code in the cell hasn't changed since.

The cell successfully ran before, but since then the code has changed, so the cell output may be stale.

The code cell is in the process of (re)running

The cell failed to execute successfully because of an error.
### Inspect results
* If your code prints out text, data frames or charts, these will appear below the code cell.
* If your code generates several printouts, these will appear below the code cell one after the other.
### Workbook language = code cell language
If you're in a Python workbook, you can only write Python code; if you're in an R workbook, you can write only Python code. If you want to work with the other language, you have to create a new workbook in that language.
# Working with packages
How to work with packages
DataLab is preconfigured with a recent version of Python and R and a host of commonly used data science and machine learning packages.
On top of that you can install additional packages or different versions of the pre-installed packages right from any notebook.
### Browsing pre-installed packages
Click on the "Environment > Pre-installed packages" in the notebook sidebar on the left. You can now browse and search an overview of all available packages. If you search for a package that is not pre-installed, you will get instructions on how to install that particular package. If you click "Add to notebook", the package install command will be added at the top of your notebook in a new code cell and immediately executed.
Open up the list of Pre-installed packages
Package install instructions that appear if you want to install a package that is not yet available.
### Installing additional packages
If a package you want to use is not pre-installed, you can install it yourself using as described below.
{% hint style="info" %}
Note that you need to reinstall packages every time your workbook session is restarted, which happens 5 minutes after closing the workbook tab or after 30 minutes of inactivity on the free plan.
To make this easy, keep track of additional package installs at the top of your notebook, so you can easily rerun the commands when you return to your workbook.
{% endhint %}
#### Python
To install additional packages, add `!pip install ` e.g. `!pip install pythonwhat` in a code cell. If you want to install a specific version of a package, including the ones that come pre-installed, use `!pip install ==`.
If you want to suppress the output when installing additional packages, you can use `%%capture` in the line above the `!pip` command:
```
%%capture
!pip install PyPortfolioOpt==1.4.2
```
#### R
If you want to suppress the output when installing additional packages, you can use the `quiet = TRUE` argument:
```
install.packages("PortfolioAnalytics", quiet = TRUE)
```
You can also use `suppressMessages()`, `suppressWarnings()` and `suppressPackageStartupMessages()` to suppress output.
#### Resolving issues
If you encounter problems when installing packages, let us know through one of the channels described in [Get help](/resources/support).
{% hint style="warning" %}
Due to security reasons, currently not all packages can be installed.
In particular installing packages with native dependencies might fail partially or completely due to a lack of permissions to execute certain installation steps.
{% endhint %}
# Text cell
Use the text cell to add text to your notebook. The text cell uses Markdown syntax, which means that you can use certain formatting queues like `**` and `_` to make text bold, italics, or to add headings and lists to your text. See [here](https://www.datacamp.com/cheat-sheet/markdown-cheat-sheet-23) for a DataCamp cheat sheet with basic syntax.
The text cell can be in two modes: editing mode or viewing mode.
### Editing mode
Use this mode write your markdown cell. A toolbar appears that you can use to easily format text, as well as add hyperlinks and images. You can also just paste an image from your local filesystem or your clipboard into a text cell; the image will be uploaded to your workbook and included with the correct Markdown syntax.
Text cell in editing mode
### Viewing mode
This is the 'rendered' version of your markdown code: headings show up as larger titles, text formatted as bold will actually be bold, and links and images will be displayed. People with viewing access to your workbook will always see your text cells in viewing mode (since they can not edit them).
The same text cell in viewing mode
### Switching modes
To switch from viewing mode to editing mode, you can do one of the following:
* Double click on the text cell
* Click "Edit" in the cell menu
* Hit `Enter` when the cell is active.
To switch from editing mode to viewing mode, you can do one of the following:
* Click "View" in the cell menu
* Hit `Ctrl` + `Enter` when the cell is active.
###
# Including images
You can include images by adding them to a text cell, using the appropriate Markdown syntax.
Example of adding images
### Include an image on your computer
There are several ways to do this:
* In a text cell, click the icon and select the file from your filesystem. The image will be uploaded to your workbook filesystem, and the required markdown syntax to display the image will be added where your cursor is.
* Copy and paste
* Copy the image on your computer
* On Windows, you can use `Ctrl` + `C` for this.
* On Mac, you can use `Cmd` + `C` .
* Paste the image into a text cell in your notebook
* On Mac, you can use `Cmd` + `V` .
* On Windows, you can use `Ctrl` + `V` for this.
* The image will be uploaded to your workbook filesystem, and the required markdown syntax to display the image will be added where your cursor is.
* Drag and drop the image on your computer into the text cell that you want to contain the image. The image will be uploaded to your workbook filesystem, and the required markdown syntax to display the image will be added where your cursor is.
* Manually upload the file and point to it in the text cell:
* Open the file browser from the menu bar: "File > Show workbook files"
* Upload the image you want to include. The filename cannot contain spaces. If it does, change the filename using the rename functionality.
* In the text cell, add `` (in this example, the filename of the image that is being included is `my_image.png`).
### Include a screenshot from your clipboard
You can easily make screenshots and add them to your notebook:
* Take the screenshot and copy it to your clipboard.
* On Windows, you can use `Windows` + `Shift` + `S` for this.
* On Mac, you can use `Cmd` + `Ctrl` + `Shift` + `4` for this.
* Paste the screenshot into your text cell
* On Windows, you can use `Ctrl` + `V` for this.
* On Mac, you can use `Cmd` + `V` for this.
The screenshot will be uploaded to your workbook files, and the required markdown syntax to display the image will be added where your cursor is.
### Include an image that in your workbook
If you already have an image file in your workbook, and want to display that in your notebook, add `` to a text cell. In this example, the filename of the image that is being included is `my_image.png`. Note that the filename should not contain spaces for this to work!
### Include image from a URL
In a text cell, add the following text (in this example, the image is available on ):
```

```
{% hint style="warning" %}
Using the `` HTML element inside a text cell to include an image will work in the editor, but the image will not render correctly in a publication. This is a limitation we're planning to fix.
{% endhint %}
# SQL cell
SQL is a first-class citizen in DataLab, with a powerful query engine to query databases, data warehouses, data frames and data files like CSV files or Excel files\*. With autocompletion, a full-fledged schema browser and SQL interpolation, DataLab brings all the SQL features you need to power your analyses.
Through the ability to query data frames and data files with SQL code, you can easily switch from SQL to Python/R and back. Through the 'Query mode' you can break up SQL queries riddled with common table expressions (CTEs) into chains of SQL cells, which makes things easier to debug and reuse.
\*Reading Excel files using SQL cells is supported in Python 3.10 and R 4.4 environments
### Using the SQL cell
* Click "Add SQL cell" at the bottom of a notebook file (or in between two cells).
* In the first dropdown in the header of the SQL cell, select **which data source you want to query**:
* To run a query **against a remote data warehouse or database**, select it from the list. If you have a SQL database that you want to connect to, see [Connect your data to DataLab](/connect-to-data/connect-your-data-to-workspace) If you don't have a SQL database to connect to, you can select one of the sample databases.
* To run a query **against a local DataFrame or CSV file** inside your workbook, select "DataFrames and CSVs".
* In the second dropdown in the SQL cell, **decide how the SQL cell should run**:
* **DataFrame mode**: the full result of the SQL query will be stored as a DataFrame with a name you can specify.
* **Query mode**: only a preview of the SQL query will show. The query is saved with a name that you can refer to in subsequent SQL queries.
* (Optional) In the input field behind 'available as', specify the name of the data frame or the query (depending on your choice in the previous step).
* Write the SQL query.
* Click "Run" in the cell menu (or use the shortcuts). Depending on the mode you selected, you'll have a DataFrame to continue your analysis or a query that you can reference in a next SQL cell.
Example of a running a query against the Ticket Sales sample database. The query result is available as tickets.
### Dive deeper
The different types of data sources to query and the different modes of querying enable powerful workflows that are useful in different combinations. Learn more about different ways of using the SQL cell in [SQL scenarios](/work/sql-cell/sql-scenarios).
Finally, there are times you want to dynamically update your SQL queries based on results of previous calculations or other data in your notebook. If this rings a bell, learn how you can [Parameterize your SQL query](/work/sql-cell/parameterize-your-sql-query).
###
# SQL scenarios
The different types of data sources to query and the different modes of querying enable powerful workflows that are useful in different combinations. Learn more about different ways of using the SQL cell in [SQL scenarios](/work/sql-cell/sql-scenarios).
#### Query a database with SQL and return a data frame, continue in Python
Create a SQL cell to query a database with a SQL cell in DataFrame mode. Next, create a Python cell and write Python code to analyze the query, e.g. to create a visualization.
Query a database with SQL, continue in Python
This approach works if you prefer Python over SQL and the SQL query you're executing doesn't return a huge result (there is a query limit of 100 MB for free users and 500 MB for Premium users).
#### Query a database with SQL and return a data frame, continue in SQL
Create a SQL cell to query a database with a SQL cell in DataFrame mode. Next, create another SQL cell, select "DataFrames and CSVs" as a source and write SQL code to query the data frame created by the first SQL cell.
Query a database with SQL, continue analyzing the dataframe with SQL
This approach works if you prefer SQL over Python and the first SQL query you're executing doesn't return a huge result (there is a query limit of 100 MB for free users and 500 MB for paying users). The second SQL query will execute right inside DataLab using [DuckDB](https://duckdb.org/). The SQL syntax is similar to PostgreSQL; check the [DuckDB docs](https://duckdb.org/docs/sql/functions/overview) for a full overview.
#### Query a CSV file or Excel file with SQL
Make sure the CSV file or Excel file you want to query is in your workbook file system by uploading it through the file browser. Next, create a SQL cell, select "DataFrames and CSVs" in the first dropdown and write SQL code to query the data file. The SQL query will execute right inside DataLab using [DuckDB](https://duckdb.org/). The SQL syntax is similar to PostgreSQL; check the [DuckDB docs](https://duckdb.org/docs/sql/functions/overview) ([CSV](https://duckdb.org/docs/stable/guides/file_formats/csv_import), [Excel](https://duckdb.org/docs/stable/guides/file_formats/csv_import)) for a full overview. Parquet and JSON files are also supported ([Docs](https://duckdb.org/docs/stable/guides/file_formats/overview)).
Query a CSV file with SQL
Query an Excel file with SQL
Use this approach if you prefer SQL over Python to analyze tabular data but have the data in a CSV file or any other supported file type by DuckDB.
#### Query a database with SQL and reference it in another SQL cell
You typically do this if you want to more easily debug a complex SQL query that consists of one or more common table expressions.
Rather than writing this:
SQL Query with a common table expression
You can write this:
CTE turned into a SQL cell in "Query mode" that is referenced in a second SQL cell.
This approach works if your first query would return a huge result. Only a preview of that query result will be shown. When you execute the second query, the 'CTE-based query' is recompiled and executed on the database side rather than locally inside your workbook. You can review the compiled SQL that's being executed by by clicking on the "View Compiled SQL" icon:
You can review the compiled SQL code that gets executed on the database side.
# Parameterize your SQL query
There are times you want to dynamically update your SQL queries based on results of previous calculations or other data in your notebook. DataLab supports this through SQL parameterization, which allows you to insert variables into your SQL queries. SQL parameterization is supported in both Python and R workbooks.
Example of parameterizing SQL queries
### Using Python
DataLab uses [Jinja](https://jinja.palletsprojects.com/en/3.0.x/intro/) to process your SQL queries and thus supports all Jinja syntax.
To insert a simple variable into your query, wrap it in double curly braces (`{{ }}`):
SELECT *
FROM dvdrentals.category C
WHERE C.category_id = {{ id }}
To insert an array in a `WHERE ... IN` statement, you can use the`inclause` filter:
{% code lineNumbers="true" %}
```sql
SELECT *
FROM dvdrentals.category C
WHERE C.category_id IN {{ ids | inclause }}
```
{% endcode %}
We use [prepared statements](https://en.wikipedia.org/wiki/Prepared_statement) to ensure you cannot accidentally inject malicious code in your SQL query. If you want to escape this safety, use the `sqlsafe` filter to mark your parameter as safe:
{% code lineNumbers="true" %}
```sql
SELECT *
FROM dvdrentals.category
WHERE {{column | sqlsafe}} = 10
```
{% endcode %}
### Using R
DataLab uses [jinjar](https://github.com/davidchall/jinjar) to process your SQL queries and thus supports most Jinja syntax in R.
To insert a simple variable into your query, wrap it in double curly braces (`{{ }}`):
SELECT *
FROM dvdrentals.category C
WHERE C.category_id = {{ id }}
To insert an array in a `WHERE ... IN` statement, DataLab provides the `join()` function:
```sql
SELECT *
FROM dvdrentals.category C
WHERE C.category_id IN ( {{ join(ids, ",") }} )
```
Alternatively, you can choose to preprocess in R yourself and inject a string, like so:
```
ids_for_sql <- paste(ids, collapse=",")
```
{% code lineNumbers="true" %}
```sql
SELECT *
FROM dvdrentals.category C
WHERE C.category_id IN ( {{ ids_for_sql }} )
```
{% endcode %}
Unlike for Python, DataLab can't protect against [SQL malicious code injection](https://en.wikipedia.org/wiki/SQL_injection) in interpolated SQL queries, so parametrize your queries with care.
# Explore Data cell
The Explore Data cell is a no-code option available in the Add New Content menu that allows users to browse data quickly without any technical knowledge. Just load a connected data source or upload a file, and let DataLab do the rest!
To use, click on "Explore data (no code)" from the Add new content menu in the Editor:
Then select your data source (and data frame if relevant) and DataLab will quickly run a SQL query behind the scenes to produce a table of the data.
After the table loads, you can create a new one simply by clicking the Chart toggle and selecting your chart type, the X-axis, and the Y-axis from the available options.
Finally, at any point, you can convert this Explore Data cell into a SQL cell type, allowing users to perform further data analysis.
# Chart cell
Next to code cells, text cells and SQL cells, DataLab also allows you to insert dedicated chart cells into your notebook. Chart cells are a way to create charts from data frames without writing *any* code. They are great for quick exploration, but also for building publication-grade visuals to include in your reports.
### Creating a chart cell (Python)
Follow these steps to create a chart cell in your workbook:
* Ensure you have at least one pandas DataFrame in your Python session that is assigned to a variable. You can do this by importing a CSV, running a [SQL cell](/work/sql-cell) or writing pandas code.
* Click on "Add Content" at the bottom of the notebook or in between two cells. Then, select "Chart".
* Select the DataFrame you want to visualize in the dropdown menu at the top left of the newly created cell.
* Don't see your DataFrame here? You might not have an active session, or the DataFrame may not exist anymore. Try re-running your previous cells to make sure the DataFrame exists in your session!
* Select the category and series that you want to display on your chart. [Learn more](/work/chart-cell/configuring-your-chart) about categories, series, and customizing your chart.
### Creating a chart cell (R)
To create a chart cell in an R session, follow the same steps as above. Instead of a pandas DataFrame, the source data for your chart must be an R data frame or the result of a [SQL cell](/work/sql-cell).
# Configuring your chart
The first step to configure your chart is to select which category and series you want to display.
## Category
In the context of charts, a **category** refers to a grouping used to organize data. Categories are often represented on the horizontal axis (x-axis). For bar charts and column charts, you can choose which axis the category should be represented on. Categories define the different sections or groups within the data being displayed. For example, in a sales report chart, categories might represent different products or time periods.
In the dropdown, you will see all of the columns from your data source. That's because all data types are valid categories! Typically though, `strings`and `dates`are the most commonly chosen data types for a chart category.
## Series
The **series** define which numerical data is plotted on the chart for each data point on the category. As opposed to categories, only a handful of data types can be selected as a series. These data types are the following:
* `number`
* `integer`
* `float`
* `boolean`
* Boolean values will be considered numbers — 0 and 1.
## Aggregate
The chart tool panel allows you to aggregate your data without needing to write SQL or code yourself! The available aggregate functions are:
* Sum
* First
* Last
* Min
* Max
* Count
* Average
## Chart types
Heading over to the *Chart* tab in the tool panel, this is where you can choose which chart type you would like to use. There are many options available, like bar, pie, line, and scatter charts. Box plots and histograms can be found under the *Statistical* section. Be aware that some chart types will change the available options in the *Set Up* tab! For example, when creating a box plot, a new option will appear where you can change its direction (horizontal/vertical).
# Pivot charts
Pivot chart comparing multiple aggregated series
In the default charting mode, you can easily create a simple chart with selected columns on both axes. However, creating a chart that compares multiple series (like the screenshot above) requires enabling the **pivot mode** by using the toggle at the top of the chart.
Toggle pivot mode
Once enabled, you will see that the *Set Up* tab has changed. Instead of choosing a category and series, you can now additionally choose *Color by* and *Group by* fields.
For this guide, we will try to recreate the chart in the top screenshot and assume a dataset about car sales with the following structure:
| brand | year | nb\_sales |
| ------ | ---- | --------- |
| Ford | 2025 | 5791 |
| Ford | 2024 | 3381 |
| Toyota | 2025 | 4002 |
| Toyota | 2024 | 5821 |
| ... | ... | ... |
**Note**: the number of sales are imaginary numbers.
#### 1. Color by
The "*Color by*" field decides which column your data will be pivoted on. In other words, the data will be split into the values of the column you choose here, and each value will be represented with a unique color. In our example, let's pick the **brands** column because we want to see the number of sales per brand.
**Note**: this is the equivalent of the "*Color"* field in the legacy chart configuration.
#### 2. Series
Similarly to the normal charting mode, series are the numerical values you want to chart. When adding a series, you'll first have to select the column. Additionally, since the data is being pivoted, you must also choose an aggregate. By default this will be set to average.
#### 3. Group by
Finally, you can optionally choose to group your data by a specific column. It's a way to split your data into different segments on top of the "*Color by*" field. In this example we can choose to group the data by year so that we can see the trends.
Finally, in the *Chart* tab, don't forget to change the chart type from a bar chart to a line chart.
# Migration guide
We recently released our overhauled chart cells! They provide you with much more power and flexibility to create and customize charts without writing any code. If you had existing charts in your workbook, from now on referred to as *legacy charts*, you can automatically convert them to our new experience.
## Converting existing charts
You will see a new button in the legacy chart cell that allows you to convert it to the new system. Clicking it will automatically convert your chart. Alternatively, a workbook that contains legacy charts will also have a banner at the top of the page, which allows you to convert all legacy charts at once.
**Note**: This is only possible if you have 5 or less legacy charts in your workbook. Converting more charts at once could result in performance issues and possibly crash the page.
Most chart configurations should convert seamlessly. However, it may be possible that something is not completely compatible. See the known limitations below.
## Known limitations
* Unsupported aggregate functions
* Median
* If used, we will automatically use `average` instead. You can get around this by manually aggregating beforehand.
* Distinct
* If used, we will automatically use `count` instead. You can get around this by manually aggregating beforehand.
* Sorting options
* Sorting is not natively supported. You may have to sort your data beforehand.
## Reporting issues
If you are unable to convert your legacy chart, you can report an issue by clicking on "Give feedback" in the left side panel, then select "Report issue". Please provide as much information as possible, such as the chart type and which data types were used on which axis.
# AI Assistant
DataLab features an OpenAI-powered AI Assistant that helps DataLab users to code better and smarter. Currently, Premium DataLab subscribers enjoy unlimited use of the AI Assistant, while Starter (free) users receive 15 lifetime requests.
## AI Assistant Features
### Chat
With "Chat", you can have a conversation with the AI Assistant to get insights from datasets, or to help you solve a data problem. The AI will answer with text, or add code to your notebook to answer the problems you're asking. To use it:
* Click on the "Chat" toggle at the bottom of your notebook.
* Click on one of the suggested prompts or ask a question of your own.
* You can use the :paperclip: icon to attach a data source for the AI Assistant to consider when answering your questions.
### Generate code
Generate will attempt to generate code based on a description
With "Generate", you can write what you want to do in natural language (e.g. English), and the AI assistant will produce a code or text snippet to achieve your intent. To use it:
* Create a new or select an existing text, code or SQL cell
* In the cell menu, click "AI".
* In the prompt that appears, type what you want to AI to do and hit Enter.
* If the cell didn't have any content, a suggestion will start streaming in. If the cell already had content, after the suggestion is finished, a diff-view will be shown displaying the suggested changes.
### Fix Error
Fix error will attempt to fix and explain the error you made
When you make a mistake in your code, you'll see a suggestion to "Fix Error". If you click this button, the AI will try to suggest a fix to your code and attempt to explain the code.
## How it works
For a schematic overview of how the AI assistant works, see the visual below:
Conceptual overview of how the AI assistant gets good results.
Beyond merely sending your prompt to OpenAI, DataLab adds additional context to the prompt, such as other variables that are defined in the workbook, the schema of connected databases (if any), previous code cells written, etc. Compared to copy pasting a prompt into ChatGPT, this approach generates way better suggestions because of all the additional information.
### What data is being shared with OpenAI?
* **DataCamp nor OpenAI uses customer data to train models**: the code or context that you pass to OpenAI will not appear as an answer to someone else's prompt.
* **DataLab sends workbook metadata to OpenAI**. Database Metadata like table names, column names and types, and workbook context like previously written code and names and types of variables are sent over to OpenAI to improve the quality of the suggestion.
* **DataLab sends the output of code cells to OpenAI**. The execution output of code cells is sent over to OpenAI to improve the quality of follow-up suggestions.
* **DataLab only sends data to OpenAI when you use AI features.** If you decide not to use AI features, or your group admin has disabled the AI Assistant, no metadata or output is sent over to OpenAI.
* **DataCamp is ISO 27001 certified,** as are these AI features. Your data is protected by solid security practices and policies. For an overview of all our safeguards, visit [this page](https://www.datacamp.com/security).
As a group admin, it is possible to enable or disable the AI assistant for your group; learn more in [Manage group settings](/resources/manage-group-settings).
# Version history
With version history, you can review and restore previous versions of notebooks in your workbook. To access the version history of a workbook, you need edit access to the workbook.
### New versions are automatically created
All changes you make to notebook files are automatically saved and a new version (attributed to the user that made the change) is created automatically as well. This happens every minute when there are new changes.
### Access version history
You can access the version history of a workbook in two ways:
* When in the editor, click on "Last edit was ... ago" in the toolbar:
* When in the editor, click on "File > View version history".
You now land in a new view with an overview of all previous version of the notebook on the right hand side. If there are multiple notebooks in your workbook, you can cycle through the version history of every notebook separately by clicking on the notebook file name in the navbar.
### Restoring a version
You can restore an older version of the notebook by clicking on the three dots next to a version and selecting "Restore this version":\
\

This is a safe operation: the restored version is simply a new version in the version history. You can simply undo the operation by restoring to a version from before the restored version (pretty meta).
# Scheduled runs
DataLab notebooks can be configured to run on a daily or weekly schedule. You can configure a scheduled run by going to 'Run > Schedule run'.
You can now configure the frequency and at what point in time the notebook should run. Additionally, you can specify whether or not you want to be notified by e-mail if the run succeeded and/or failed.
Email notifications are a personal setting per scheduled notebook run. This means that if you are collaborating on a notebook, you and your peer can have different settings for the e-mail notifications for the same notebook schedule.
You can only specify one schedule per notebook; it's not possible to have a notebook run multiple times per day on a schedule.
For long-running notebooks the same limitations apply as dictated in [Long-running cells](/work/long-running-cells).
### Scheduled run variable
The built-in `DL_SCHEDULED_RUN` environment variable can be used to figure out whether a notebook is being run as part of a scheduled run. You can use this environment variable to decide if you want to do certain things on a schedule but not when run manually or vice versa.
As an example, you may want to post a summary of the analysis in your scheduled notebook to Slack but you don't want to accidentally post anything when you're just working on improving the analysis.
The `DL_SCHEDULED_RUN` environment variable is set to `"TRUE"` when the notebook is being run as part of a scheduled run. The environment variable is not set if the notebook is being run manually, not as part of a scheduled run:
```python
# Python
import os
if os.environ.get('DL_SCHEDULED_RUN') == 'TRUE':
# Your side effect here
```
```r
# R
if (Sys.getenv("DL_SCHEDULED_RUN") == "TRUE") {
# Your side effect here
}
```
# Hiding and showing cells
You can hide and show the code and/or output of one or all cells in a notebook. This allows you to pull the attention towards the insights that matter, keeping all of your data cleaning and theming plumbing out of sight. The code and output of a cell that you hide won’t be visible in [reader mode](https://workspace-docs.datacamp.com/work/reader-mode).
To hide the code portion of a code or SQL cell, click the 'eye' icon that appears next to the code:
Hiding the code portion of a cell
Result of hiding the code portion of a cell
To hide the output portion of a cell, click the 'eye' icon that appears next to the output.
Hiding the output portion of a cell
Result of hiding the output portion of a cell
You can also hide both the code and the output, which collapses the entire cell into a line. Multiple adjacent hidden cells will also show up as one line.
Result of hiding the code and output portion of a cell
# Long-running cells
Some data analysis workflows require long-running tasks. This page explains what happens to your session if you run code that takes a long time to execute.
When you run code on DataLab, you run this code in an isolated environment on one of DataCamp-managed cloud servers, called a 'session'. When you are no longer working in your workbook for a while, your session will stop to avoid paying for unused server capacity.
When your session stops, all the variables in your notebook are gone. Any files that your code created will be saved and available for the next time when you open your workbook.
So when does the session stop?
* For free users, the session will stop if there is no code running, and the last code cell execution or notebook edit happened:
* 30 minutes ago if you still have the workbook open in a browser tab.
* 5 minutes ago if you don't have the workbook open in a browser tab.
Regardless of code running, your session will stop 6 hours after being started.
* For paying users, the session will stop if there is no code running, and the last code cell execution or notebook edit happened:
* 2 hours ago if you still have the workbook editor open in a browser tab.
* 5 minutes ago if you don't have the workbook open in a browser tab.
Regardless of code running, your session will stop 24 hours after being started.
In other words, if you are running cells that take a long time to complete, this cell will continue running until completion, after which you still have some time to pick up the work again.
{% hint style="warning" %}
#### Note on Chrome Memory Saver
If you are using Google Chrome with the Memory Saver feature enabled, be aware that inactive tabs may automatically enter a sleep mode to conserve system resources. This could affect your workbook sessions if left idle, potentially causing them to shut down. To prevent this, consider adding DataLab to the list of sites that are exempt from the Memory Saver feature. [**Link**](https://support.google.com/chrome/answer/12929150?hl=en#zippy=%2Ckeep-specific-sites-active)
{% endhint %}
#### Examples
Example 1: Mia is a free DataLab user and starts a workbook that does some hyperparameter tuning for a random forest regression model, which takes 4 hour to complete. She leaves the workbook tab open and comes back 10 minutes after the tuning step completed. The workbook session is still active, so Mia can interactively explore the variables that were created during the hyperparameter tuning. Mia then goes for dinner and returns back to her workbook. She finds that her workbook session closed, since she has been idle for more than 30 minutes. She can still view the notebook and other files in her workbook, but the variables are gone.
Example 2: Same as example 1, but Mia doesn't leave the workbook tab open and instead closes it. When Mia comes back 10 minutes after the tuning step completed, she'll find that her workbook session is shut down because the last code cell execution was more than 5 minutes ago. She can still view the notebook and other files in her workbook, but the variables are gone. To make sure that Mia doesn't lose the work of the hyperparameter tuning, she can update her code to save the final outcome to disk, so she can load it and continue working where she left off.
# Report view
### Overview
*Report* is a simplified view of your notebook that automatically hides code cells. This article provides guidance on how to use Report.
You can find the Report toggle on the top right in your workbook interface.
### How Report View Works
In Report view, code cells are hidden by default, presenting a cleaner view focused on the notebook's text content and outputs. However, the code is not removed or altered, and you can access any hidden code cell at any time by clicking on *View code* next to the cell, when hovering over it.
Remember that changing the reader mode status does not alter the notebook contents—it only changes the way it is displayed.
# Environment variables
Environment variables, as the name suggests, are variables in your system that describe your environment. In data projects they are typically used to securely store passwords, secrets, and tokens to access data sources that are not natively supported or to connect to external services (like GitHub and Slack).
When you connect a set of environment variables to your workbook, you can access these variables with some simple Python or R code. This is a safer approach compared to just copy-pasting secrets in your notebook verbatim straight away:
```python
# The bad way
secret_token = "enz8vcb5WYB9pky@hpn"
# The good way
secret_token = os.environ.get("API_TOKEN")
```
To start using environment variables, head over to "Environment > Environment variables" in the menu bar and click on "Add" sign in the environment section:
Browse environment variables
Environment variables dialog
In DataLab, environment variables are created as sets, so environment variables that are related (e.g. used for the same data connection) can be managed together.
Before you can use a set of environment variables in your workbook session, make sure you connect them; your workbook session will restart for these changes to take effect. The next time you boot up the workbook, the environment variables that were connected to the workbook before will be reconnected automatically.
{% hint style="info" %}
Your secrets in the enterprise-grade security storage solution [Vault](https://www.vaultproject.io/), built and managed by Hashicorp. Your secrets are never stored on DataCamp's servers unless you print them out in clear text in your workbook.
{% endhint %}
#### Who can see and use environment variables I set up?
If you set up environment variables in your personal account, only you can connect and use them. They can not be shared with other users. This means that you cannot invite other users as an editor to a personal workbook that has environment variables connected.
If you set up environment variables in a group that you're a part of, you can use and edit the environment variables, but also other members of the group can use the environment variables. See [Sharing a Data Source](/connect-to-data/sharing-a-data-source) for more information on these controls.
#### Can I lock down my database to specific IP addresses?
When using the [SQL cell](/work/sql-cell), DataLab will connect to your database through one of three DataCamp-owned, fixed IP addresses, listed in [Connect your data to DataLab](/connect-to-data/connect-your-data-to-workspace).
If you want to use Python or R to connect to a data source that is not natively supported, e.g. MongoDB or Amazon S3, the session will do so from one of these three DataCamp-owned, fixed IP addresses:
* `23.23.63.130`
* `3.233.97.1`
* `3.88.83.220`
# Git and GitHub
You can configure and work with Git by leveraging [Environment variables](/work/environment-variables). This way, you don't need to enter these details every time you want to push to or pull from a Git repository.
The following environment variables are required to connect to a Git repository. You can choose the name for this set of environment variables freely.
* `GIT_AUTHOR_EMAIL`
* `GIT_AUTHOR_NAME`
* `GIT_COMMITTER_EMAIL`
* `GIT_COMMITTER_NAME`
* `GIT_USERNAME`
* `GIT_PASSWORD` (see below for instructions for GitHub)

After setting up your environment variables and connecting them to your workbook, you can open a terminal by opening the **Run** menu and choosing **Open Terminal**. Run the following command:
```
$ git clone
```
This command will clone your git repository in a new folder using the name of the repository as the name of the folder. In order to clone into the top level directory of your workbook, the directory your terminal opens up in, you can append `.` to the command. This will only work if the current directory is empty.
```
$ git clone .
```
### GitHub
In order to connect to GitHub, the `GIT_PASSWORD` environment variable should be a Personal Access Token (PAT). See the [GitHub documentation](https://docs.github.com/en/authentication/keeping-your-account-and-data-secure/creating-a-personal-access-token) to create a PAT with the right permissions.
After configuring and connecting the environment variables, you can open a terminal by opening the **Run** menu and choosing **Open Terminal**. Now you can clone a private repository for example. Make sure to use the web URL of the GitHub repository, starting with `https://`:
```
$ git clone https://github.com//.git
```
# Connect your data to DataLab
DataLab makes querying databases and data warehouses a breeze. You can query a growing list of database technologies with DataLab's [SQL cell](/work/sql-cell):
* [Amazon Athena](/connect-to-data/athena)
* [Databricks](/connect-to-data/databricks)
* [Files](/connect-to-data/files)
* [Google BigQuery](/connect-to-data/bigquery)
* [Google Sheets](/connect-to-data/google-sheets)
* [MariaDB](/connect-to-data/mariadb)
* [Microsoft SQL Server](/connect-to-data/sql-server)
* [MotherDuck](/connect-to-data/motherduck)
* [MySQL](/connect-to-data/mysql)
* [Oracle Database](/connect-to-data/oracle-db)
* [PostgreSQL](/connect-to-data/postgresql)
* [Redshift](/connect-to-data/redshift)
* [Snowflake](/connect-to-data/snowflake)
For data storage solutions and technologies that are not yet natively supported through the SQL cell, you can use [Environment variables](/work/environment-variables) in combination with Python or R to securely read and write data. Visit the dedicated documentation articles for instructions. If you'd like us to add native support or documentation for additional database technologies, [reach out](/resources/support)!
### Preparing to connect
To set up a connection between DataLab and a database, you will provide DataLab with the credentials for a user account in your database. DataLab will use these credentials to execute queries against the database. The permissions of this user account will control which tables and records you can access when querying this database.
We recommend you create (or ask your database admin to create) a new database user specifically for using with DataLab. Grant this new user read-only permission for the schemas and tables you want users to be able to query with the SQL cell.
In addition to getting the credentials, ensure your database:
* Is accessible from the internet (see [#how-do-i-know-if-my-database-is-publicly-accessible](#how-do-i-know-if-my-database-is-publicly-accessible "mention"))
* Is allowed to accept incoming connections from DataLab's IP addresses (all connections from DataLab will come from one of these three IP addresses):
* `34.196.109.37`
* `52.202.191.84`
* `52.45.90.208`
If your database or network environment can not be configured to meet the above requirements, [reach out](/resources/support); we're happy to help!
### How to connect
1. Sign in to DataLab.
2. Click **Databases** in the sidebar
3. Click **Connect Database**
4. Follow the instructions to connect your database and test the connection.
Once database credentials are filled in and the database connection is set up, for security reasons the credentials can not be consulted again.
### Use a sample database
Don't have a database but still want to experiment with native database connections and SQL cells? DataLab features sample databases for every natively supported database technology. You can select the sample database in the dropdown when you create a SQL cell.
### FAQ
#### Who can see and use database connections I set up?
If you set up a database connection in your personal account, only you can use and edit this database connection. It can not be shared with other users. This means that you cannot invite other users as an editor to a personal workbook that has a database connected.
If you set up the database connection in a group that you're a part of, you can use and edit the database connection, but other members of the group can also use the database connection. It is possible to control who can use your data source within the group. See [Sharing a Data Source](/connect-to-data/sharing-a-data-source) for more information.
#### How do I know if my database is accessible on the internet?
A database is "publicly accessible" if the server the database is hosted on can be reached via any internet connection, not requiring users to be logged into a VPN or connected to a private network.
To check if your database is publicly accessible, run the following command on a computer that's not logged into your VPN or private network. Replace `your_db_host` and `your_db_port` with the host and port of your database:
* Linux or OSX: `nc -v your_db_host your_db_port`
* Windows: `telnet your_db_host your_db_port`
Databases that are running on your computer (i.e. on localhost) are also not publicly accessible, unless you expose them to the internet through tools like [ngrok](https://ngrok.com/) or [Tailscale](https://tailscale.com/).
### Security
DataLab allows you to use TLS/SSL (Transport Layer Security/Secure Socket Layer) to encrypt communication with your database. This encrypts data while it's in transit between your database and DataLab. For auditing purposes, DataLab tracks who executed which query in what workbook and when.
DataCamp is ISO 27001 certified. Your data is protected by solid security practices and policies. For more information, see DataCamp's [approach to security](https://www.datacamp.com/security) and [privacy policy](https://www.datacamp.com/privacy-policy#information-security).
###
# Sharing a Data Source
{% hint style="warning" %}
The controls described in this ticket are only available in a group context.
{% endhint %}
DataLab offers role-based access controls for [Data Sources](/connect-to-data/connect-your-data-to-workspace) and [Environment Variables](/work/environment-variables) created in a group context. For the remainder of this article these will be referenced as an **Integration**.
To manage the access controls to an Integration, find the "Share" button in the Data Source detail screen or the dropdown menu of an Environment Variable integration. This will open the sharing modal.
Data Source sharing modal
In this modal, you can:
* Add specific people to use your Integration by using their email
* Today, you can only invite users that already have a DataCamp account.
* Change the group-wide access to your Integration
### Roles
You can give different people (or groups of people) different roles:
* **View-Only** - Can only view data from this Integration, not use code to query it.
* **Query** - Can connect workbooks to the Integration and query it.
* **Manage** (only specific users) - Can query and manage sharing settings of the Integration.
### Interaction with workbook access roles
The access given to Integrations affects the access a user has on a workbook. Integrations connected to a workbook can cause a downgrade of the workbook access and users are presented with the option to request necessary permissions.
For example, if a user has the 'Editor' role on a workbook, it is required to have the 'Query' role on all connected integrations. If the user only has the 'View-Only' role on a subset of connected integrations, the workbook access is downgraded to 'Viewer'. If the user has no access to a subset of connected integrations, the workbook access is downgraded to 'No access'.
Assigned roles on integrations **will not** cause an upgrade of workbook access. Having 'Query' access to a connected integration will not cause a user to get the 'Editor' role on a workbook if only assigned the 'Viewer' role.
# Airtable
This article covers all the necessary steps to connect to Airtable and query Airtable data with Python from inside DataLab. These steps and the necessary sample code are also available in [this workbook](https://app.datacamp.com/workspace/w/7417723b-2447-4b30-ad0c-3f8cf1ea53ec/edit) (click [this link](https://app.datacamp.com/workspace/new?_tag=workspace\&title=Connect%20to%20Airtable\&accountType=personal\&utm_content=copy_duplicate_link\&utm_medium=in_product\&utm_source=workspace\&visibility=public\&workspaceId=7417723b-2447-4b30-ad0c-3f8cf1ea53ec) to create your own copy).
### Setup
You need to take a couple of setup steps in Airtable and DataLab to set up a so-called personal access token that you can use to programmatically access data in Airtable.
* Create an Airtable account if you haven't already [here](https://airtable.com/signup#).
* Make sure your Airtable account contains a 'base' (a database). If you don't have data lying around, click "Start with templates" on your Airtable Homepage.
* Create the personal access token:
* Click on your avatar icon top right, and select "Developer Hub"
* In the "Personal access tokens" tab, click "Create new token"
* Specify a name for your token, e.g. 'DataLab Access'
* Add a scope. `data.records:read` is enough if you want to fetch data from Airtable. If you also want to write back results of your calculations to Airtable, add `data.records:write` as well.
* Add a base to access. You can select just one base or all current and future bases in your workbook. Make sure you at least select the base that you want to access from inside DataLab.
* Click "Create token"
* Copy the generated personal access token (PAT) to your clipboard for later use.
Create a Personal Access Token in Airtable
* Securely store the PAT in DataLab as an [environment variable](/work/environment-variables):
* In the DataLab editor, open up the environment variables in the menu bar (Environment > Environment variables) and click on "Add".
* Set `Name` to `AIRTABLE_PAT`
* In `Value` paste the PAT that you copied to your clipboard in the previous step.
* Set the "Environment Variable Set Name" to something meaningful, e.g. "Airtable PAT"
* Click "Create", "Next" and finally, "Connect". Your workbook session will restart, and `AIRTABLE_PAT` will now be available as an environment variable in your workbook.
Store the Airtable PAT in DataLab as an environment variable
If you've done all of the steps above successfully, you're now ready to run some Python code to connect to Airtable data! The code is available in [this workbook](https://app.datacamp.com/workspace/w/7417723b-2447-4b30-ad0c-3f8cf1ea53ec/edit); you can click [this link](https://app.datacamp.com/workspace/new?_tag=workspace\&title=Connect%20to%20Airtable\&accountType=personal\&utm_content=copy_duplicate_link\&utm_medium=in_product\&utm_source=workspace\&visibility=public\&workspaceId=7417723b-2447-4b30-ad0c-3f8cf1ea53ec) to create your own copy that you can edit to your use case.
# Amazon Athena
## Set up an Amazon Athena data connection
When inside a workbook, click **View** > **Databases**, then click the **+** icon and follow the on-screen instructions. For more information on how to configure Amazon Athena and how to generate access keys, click [here](https://docs.aws.amazon.com/athena/latest/ug/what-is.html). Make sure the IAM user associated with the credentials has write access to the specified output bucket/folder. The output folder is used to write results of your query to and is ideally separated from the main data in the bucket.
Note: the output bucket should be an s3 url, meaning it should start with `s3://`
For detailed instructions, see [Connect your data to DataLab](/connect-to-data/connect-your-data-to-workspace).
## Query the database
You can now query Amazon Athena with a [SQL cell](/work/sql-cell). Select it in the **Select source** dropdown in the top left corner of a SQL cell, or select the sample Amazon Athena connection.
Example of a SQL cell using the MyAthena connection. The query result is available as df1.
# Amazon S3
This article covers all the necessary steps to access files on Amazon S3, AWS's simple storage solution, from inside DataLab.
### Setup
#### Create an Amazon S3 Bucket
You need to have an existing Amazon S3 bucket (which is the S3 equivalent of a file folder). If you don't have a bucket yet, follow the instructions in [this AWS documentation article](https://docs.aws.amazon.com/AmazonS3/latest/userguide/create-bucket-overview.html) to create one.
#### Locate your access key credentials
To programmatically access resources on AWS you need to create an access key that consists of an Access key ID and a Secret key that has the right permissions for what you intend to do with the S3 bucket from inside DataLab.
If you don't yet have such an access key, follow the instructions in [this AWS documentation article](https://docs.aws.amazon.com/powershell/latest/userguide/pstools-appendix-sign-up.html) to create a new access key.
#### Create a new workbook
Create a new, empty workbook, or click [this link](https://app.datacamp.com/workspace/new?_tag=workspace\&title=Connect%20to%20Amazon%20S3\&accountType=personal\&utm_content=copy_duplicate_link\&utm_medium=in_product\&utm_source=workspace\&visibility=private\&workspaceId=915bcb10-8407-4026-b734-e5c1ba351077) to create a workbook in your own account that contains all the Python code you need to connect to Amazon S3.
#### Store account key credentials in DataLab
To use the account key credentials in this workbook, you need to store them in DataLab. To do so securely, you can use [Environment variables](/work/environment-variables).
In your new workbook, open "Environment > Environment variables..." in the menu bar, and click on "Add". You need to create a new set with 2 environment variables:
* `AWS_ACCESS_KEY_ID`: Set this to the access key ID you got in the previous step.
* `AWS_SECRET_ACCESS_KEY`: Set this to the secret key you got in the previous step.
* Set a meaningful "Environment Variable Set Name", e.g. "AWS Access Key".
Set up AWS environment variables in DataLab.
After filling in all fields, click "Create", "Next" and finally, "Connect". Your workbook session will restart, and `AWS_ACCESS_KEY_ID` and `AWS_SECRET_KEY` will now be available as environment variables in this workbook.
### Connect to Amazon S3 with Python
You can now switch to Python to access the files. We'll use `boto3` for this, which is the official Python package to create, configure, and manage AWS services, among which Amazon S3. It's already installed by default, so we only have to import it.
```python
import boto3
```
To verify that everything was set up okay, let's list all the objects (files) in a specific S3 bucket. Make sure to update the `AWS_BUCKET_NAME` to a bucket that is available in your AWS account.
```python
AWS_BUCKET_NAME = "datacamp-workspacedemo-workspacedemos3-prod" # change this
# Create the s3 resource
s3 = boto3.resource('s3')
# Load the bucket with specified name.
bucket = s3.Bucket(AWS_BUCKET_NAME)
# List all objects (files or folders) in the bucket
[ obj.key for obj in bucket.objects.all() ]
```
This should've worked! Note that you don't need to explicitly fetch and provide the `AWS_ACCESS_KEY_ID` and `AWS_SECRET_ACCESS_KEY` environment variables; `boto3` expects these environment variables to be there with those names, and loads them behind the scenes.
### Going deeper
Other than listing files, `boto3` allows you to download and upload files, manage buckets, etc. Consult the [`boto3` documentation](https://boto3.amazonaws.com/v1/documentation/api/latest/index.html) to learn more.
# Databricks
## Copy your credentials
Find the following values:
* **Server hostname.** This looks something like `dbc-a1b2345c-d6e7.cloud.databricks.com`.
* **HTTP Path.** This will look similar to `/sql/1.0/endpoints/a1b234c5678901d2`.
* **Token.** This will be similar to `dapi12345678901234567890123456789012`.
## Set up a database connection
When inside a workbook, click **View** > **Databases**, then click the **+** icon and follow the on-screen instructions.
## Query the SQL Warehouse
You can now query your Databricks SQL warehouse with a [SQL cell](/work/sql-cell). Select it in the **Select source** dropdown in the top left corner of a SQL cell.
# Dropbox
This article covers all the necessary steps to access and manage files on Dropbox from inside DataLab. The guide assumes that you already have a Dropbox account.
### Setup
Sign in to your Dropbox account, head over to [https://www.dropbox.com/developers/apps](https://app.datacamp.com/workspace/external-link?url=https%3A%2F%2Fwww.dropbox.com%2Fdevelopers%2Fapps) and click "Create app".
In the app creation form:
* Select the "Scoped access" API.
* Choose the type of access you need.
* Specify a name for your app.
Create a Dropbox App
After the app is created, head over to the Permissions tab and select the correct access scopes for what you intend to do. For example, if you only want to use Workspace to programmatically read content from Dropbox, `files.metadata.read` and `files.content.read` is enough. Make sure to click "Submit" in the footer to persist the changes.
Select access scopes for your dropbox app
Go back to the settings tab, and in the OAuth 2 section click "Generate" to generate an access token. Copy the access token to your clipboard.
Generate access token
Securely store the access token as an [environment variable](https://workspace-docs.datacamp.com/work/environment-variables) in Workspace:
* In your workbook, open "Environment > Environment variables..." in the menu bar, and click on "Add". You need to create a new set with one environment variable:
* Set `Name` to `DROPBOX_ACCESS_TOKEN`
* In `Value` paste the access token that you copied to your clipboard in the previous step.
* Set the "Environment Variable Set Name" to something meaningful, e.g. "Dropbox Access Token"
* Click "Create", "Next" and finally, "Connect". Your workspace session will restart, and `DROPBOX_ACCESS_TOKEN` will now be available as an environment variable in your workspace session.
Store access token as an environment variable in Workspace
If you've done all of the steps above successfully, you're now ready to run some Python code to access Dropbox files! The code is available in [this workspace](https://app.datacamp.com/workspace/w/c3ad6a3d-8dde-40c1-93ff-53f9bf39bd36/edit); you can click [this link](https://app.datacamp.com/workspace/new?_tag=workspace\&title=Connect%20to%20Dropbox\&accountType=personal\&utm_content=copy_duplicate_link\&utm_medium=in_product\&utm_source=workspace\&visibility=public\&workspaceId=c3ad6a3d-8dde-40c1-93ff-53f9bf39bd36) to create your own copy that you can edit to your use case.
# Files
A files data source allows you to share files in a read-only way between multiple workbooks within a single account context.
## Set up a file data source
Select **Data Sources** in the sidebar and click on **New Data Source** in the screen that follows. You'll be prompted to select the type of the data source. Either drag in files you want to use to create a data source or press **browse files** to select the files you want to upload.
A *files* data source will be created and you'll see an overview on the following screen. Here you can update the name, change the description, upload more files or just browse a preview of the data.
## Query a files data source
You can now query your files data source with a [SQL cell](/work/sql-cell). Select it in the **Select source** dropdown in the top left corner of a SQL cell. You can query the individual files by specifying their name in the `FROM` clause. The schema of the data source is also available by clicking on **Browse Files**, from here it's also easy to start querying individual files.
# Google Drive
This article covers all the necessary steps to access and manage files on Google Drive, Google's cloud storage solution, from inside DataLab.
### Setup
Before you can run Python code to programmatically access data in Google Sheets, you need to the following steps, which we will go through in detail step by step:
* Enable the Google Sheets API
* Create a Google service account for programmatic access.
* Share the files you want to access with the service account.
* Store the service account credentials in DataLab.
#### Enable the Google Drive API
* Make sure you’re signed in with your Google account.
* Navigate to the [Google API Library](https://console.developers.google.com/apis/library)
* Create a new project by clicking in the dropdown on the navbar.
* Search for the “Google Drive API” and enable it. This can take up to 10 seconds.
{% embed url="" %}
Create a new Google Cloud project and enable the Google Drive API
{% endembed %}
#### Configure a Google Service Account
* In the “APIs and services” navbar on the left, go to the “Credentials tab”
A Google service account is a special kind of account that can be used by programs to access Google resources like your Drive. You will use this service account to connect DataLab to Google Drive.
You only have to set up this Google service account once for every Google account that you want to access Google resources with; you can skip this step the next time.
{% embed url="" %}
Create a google service account
{% endembed %}
Follow the steps below to create the service account and generate the necessary credentials:
* Click on “+ CREATE CREDENTIALS” and select “Service Account”
* In the first step (service account details), provide a name for the service account, e.g., “google-operator” and click on “Create and continue”
* In the second step, select the “Owner” role and click “Continue”
* In the third step, don’t change anything and click “Done”
* Once back on the Credentials page, click on the service account you just created.
* Go to the Keys tab, click “Add Key > Create new key”
* Choose “JSON”, then click “Create.” The JSON file with your service account credentials will automatically download to your computer.
You now have a service account and a JSON credentials file! Head over to your Downloads folder or wherever the JSON file was downloaded, open it up, and have a look. It should look something like this:
```json
{
"type": "service_account",
"project_id": "",
"private_key_id": "",
"private_key": "-----BEGIN PRIVATE KEY-----\nM.iam.gserviceaccount.com"
}
```
There’s a `client_email` field in there, along the lines of [google-operator@\.iam.gserviceaccount.com](mailto:gsheets-operator@steam-verve-386214.iam.gserviceaccount.com). Copy this email to your clipboard; you’ll need it in the next step.
### Share Google Drive files with the service account
Your service account can only access Google Drive files that it has access to, so need to go through files in your Google Drive folder and share them with the email of the service account that you copied to your clipboard in the previous step. If you just want to read the files, "Viewer" access is enough.
Share a Google Drive file with a service account
### Create a new workbook
Click [this link](https://app.datacamp.com/workspace/new?_tag=workspace\&title=Connect%20to%20Google%20Drive\&accountType=personal\&utm_content=copy_duplicate_link\&utm_medium=in_product\&utm_source=workspace\&visibility=public\&workspaceId=4c6c2c21-15ec-420a-ac57-f74d9bf92338) to create a workbook in your own account that contains example Python code to connect to Google Drive, list all the files the service account has access to, and download an example CSV file.
### Store service account credentials in DataLab
We'll use [Environment variables](/work/environment-variables) to securely store the service account credentials JSON in your workbook.
In your new workbook, open "Environment > Environment variables..." in the menu bar, and click on "Add". Next:
* Set `Name` to `GOOGLE_JSON`
* Set `Value` to the full contents of the service account JSON file that was downloaded. You can do this by opening the JSON file, selecting all, copying it to your clipboard, and then pasting it in the Value field.
* Set the “Environment Variable Set Name” to “Google Service Account” (this can be anything, really)
Set up GOOGLE_JSON environment variable
After filling in all fields, click “Create,” “Next,” and finally, “Connect.” Your workbook session will restart, and `GOOGLE_JSON` will now be available as an environment variable in your workbook. You can verify this by creating a Python cell with the following code and running it:
If you want to reuse the same services account credentials in another workbook, you don’t need to set up the environment variable again: you can connect the environment variable to your other workspaces as well.
### List files in Google Drive
Use the Python code snippets in the workbook that you created before (with [this link](https://app.datacamp.com/workspace/new?_tag=workspace\&title=Connect%20to%20Google%20Drive\&accountType=personal\&utm_content=copy_duplicate_link\&utm_medium=in_product\&utm_source=workspace\&visibility=public\&workspaceId=4c6c2c21-15ec-420a-ac57-f74d9bf92338)) to install the necessary packages, list all the files in your Google Drive that your account has access to, and download an example CSV file; all from Python!
# Google BigQuery
## Set up a BigQuery warehouse
If you already have a BigQuery warehouse set up, you can skip this step.
* Visit
* In the search bar, look for BigQuery
* Go through one of the guides to "Add your own data".
* You can test that things work by querying the resulting dataset table.
#### Configure a Google Service Account
A Google service account is a special kind of account that can be used by programs to access Google resources like a BigQuery data warehouse. You will use this service account to connect DataCamp DataLab to your BigQuery warehouse.
To set up a new Google Service Account, please refer to [this excellent guide](https://docs.openbridge.com/en/articles/1856793-how-to-set-up-google-bigquery-creating-and-configuring-service-accounts-in-google-cloud-console). At the end of it, you'll have the JSON credentials file that you can use to set up the BigQuery connection in DataLab.
## Set up a Google BigQuery connection
When inside a workbook, click **View** > **Databases**, then click the **+** icon and follow the on-screen instructions. Upload the Service Account JSON and hit "Connect".
Create a BigQuery connection
For detailed instructions, see [Connect your data to DataLab](/connect-to-data/connect-your-data-to-workspace).
## Query the database
You can now query the BigQuery data warehouse with a [SQL cell](/work/sql-cell). Select it in the **Select source** dropdown in the top left corner of a SQL cell, or select the sample BigQuery data warehouse.
Example of a SQL cell using the BigQuery Integration connection. The query result is available as df.
# Google Sheets
DataLab supports two ways to work with data in Google Sheets.
* With the built-in Google Sheets connector and the [SQL cell](/work/sql-cell): by far the simplest way, but only supports reading data from Google Sheets, not writing back data to Google Sheets.
* With the Google Sheets API and [Environment variables](/work/environment-variables): requires more setup, but gives you maximum flexibility.
## Read Google Sheets data with the built-in connector
Choose this option if you only want to read data from a Google Sheet to analyze in Python but are not looking to write the results of your calculations back to a Google Sheet.
### Set up a connection
When inside a workbook, click **View** > **Databases**, click the **+** icon, select **Google Sheets** and follow the on-screen instructions. You will be prompted to grant DataLab permission to access files in your Google Drive.
At some point a file picker will appear, where you can select the spreadsheet to access:
Select the Google Sheet file that you want to fetch data from with DataLab
### Query the Google Sheets file
You can now query the Google Sheets file you just connected with a [SQL cell](/work/sql-cell). Select it in the **Select source** dropdown in the top left corner of a SQL cell, write a SQL query, and hit run:
SQL query that imports all rows from the unicorn_companies sheet in the Unicorn Companies Google Sheet.
By default, the result of your query is now available as a Pandas DataFrame (if you're working in Python) or a data.frame (if you're working in R) to continue your analysis. See [SQL cell](/work/sql-cell) for more information.
There are several ways to refer to sheets. Suppose you want to query a sheet named `Players`:
```sql
-- Works
SELECT * FROM Players
SELECT * FROM main.Players
SELECT * FROM "Players"
SELECT * FROM 'Players'
SELECT * FROM main."Players"
-- Does not work
SELECT * FROM "main.Players"
SELECT * FROM main.'Players'
SELECT * FROM 'main.Players'
```
If you're trying to query a sheet that has spaces in it, you have to use quotes to refer to the sheet name.
### Additional notes
* You can use Google Sheets syntax to 'zoom in' on a particular selection of your spreadsheet, e.g. `SELECT * FROM 'unicorn_companies!B2:C13'`
* The connector assumes that the first row contains the column names and will infer the Google Sheets schema from that.
* Every Google Sheets file you connected corresponds to a 'database' in DataLab. This means:
* You can query different sheets inside the same Google Sheets file with one connection.
* You have to set up a new database for every Google Sheets file you want to access from inside DataLab.
* Every workbook collaborator that wants to query a Google Sheet will need to authenticate themselves with Google; only Google users that have read access to the Google Sheet in question will be able to query the Google Sheet.
* At the moment, you can only use the Google Sheets database for reading data from a Google Sheets file. Writing back results to Google Sheets is not (yet) supported.
## Read and write Google Sheets data with the Google Sheets API
Choose this option if you want to both read data from a Google Sheet as well as write the result of your calculations in Python back to the same or another Google Sheet.
### Setup
Before you can run Python code to programmatically access data in Google Sheets, you need to:
* Enable the Google Sheets API
* Create a Google service account for programmatic access.
* Ensure you have a Google spreadsheet with data that the service account can access.
* Store the service account credentials in DataLab.
In what follows, all these steps are laid out in detail.
#### Enable the Google Sheets API
* Make sure you’re signed in with your Google account.
* Navigate to the [Google API Library](https://console.developers.google.com/apis/library)
* Create a new project (if you haven't created one before) by clicking in the dropdown on the navbar.
* Search for the “Google Sheets API” and enable it. This can take up to 10 seconds.
{% embed url="" %}
Create a new Google Cloud project and enable the Google Sheets API
{% endembed %}
#### Configure a Google Service Account
A Google service account is a special kind of account that can be used by programs to access Google resources like a spreadsheet. You will use this service account to connect DataLab to Google Sheets.
You only have to set up this Google service account once for every Google account that you want to access Google resources with; you can skip this step the next time.
{% embed url="" %}
Create a google service account
{% endembed %}
Follow the steps below to create the service account and generate the necessary credentials:
* In the “APIs and services” navbar on the left, go to the “Credentials tab”
* Click on “+ CREATE CREDENTIALS” and select “Service Account”
* In the first step (service account details), provide a name for the service account, e.g., “gsheet-operator” and click on “Create and continue”
* In the second step, select the “Owner” role and click “Continue”
* In the third step, don’t change anything and click “Done”
* Once back on the Credentials page, click on the service account you just created.
* Go to the Keys tab, click “Add Key > Create new key”
* Choose “JSON”, then click “Create.” The JSON file with your service account credentials will automatically download to your computer.
You now have a service account and a JSON credentials file! Head over to your Downloads folder or wherever the JSON file was downloaded, open it up, and have a look. It should look something like this:
```json
{
"type": "service_account",
"project_id": "",
"private_key_id": "",
"private_key": "-----BEGIN PRIVATE KEY-----\nM.iam.gserviceaccount.com"
}
```
There’s a `client_email` field in there: [gsheets-operator@\.iam.gserviceaccount.com](mailto:gsheets-operator@steam-verve-386214.iam.gserviceaccount.com). Copy this email to your clipboard; you’ll need it in the next step.
### Create a Google Spreadsheet With Data
Before you can analyze data in spreadsheets, you need to make sure you have a spreadsheet with data in it. If you don’t have a dataset lying around, you can start from a Google Sheet that we prepared for this tutorial: Open the [example spreadsheet](https://docs.google.com/spreadsheets/d/1yjDGNBg6nZkQVpkmiY3iz0H5xggDxPFBh2HEPHIcGj8/edit#gid=712927798) and once in the Google Sheet, click “File > Make a copy,” specify a name, and click “Make a copy.” If you already have a spreadsheet with data you want to analyze, just open up that spreadsheet.
Regardless of whether you’re working with a duplicate of the example spreadsheet or your own spreadsheet, you need to give the Google service account that you created in the first step access to the spreadsheet:
* Click “Share”
* Add the email of the service account that you copied to your clipboard in the previous step as an editor to the spreadsheet (e.g. [gsheets-operator@\.iam.gserviceaccount.com](mailto:gsheets-operator@steam-verve-386214.iam.gserviceaccount.com))
* Click “Send”
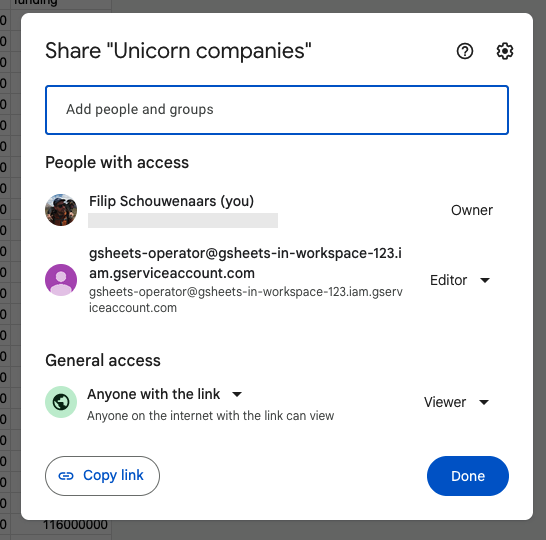
Alright, service account: check. Google spreadsheet with the right access: check.
### Create a new workbook
Click [this link](https://app.datacamp.com/workspace/new?_tag=workspace\&title=Connect%20to%20Google%20Sheets\&accountType=personal\&utm_content=copy_duplicate_link\&utm_medium=in_product\&utm_source=workspace\&visibility=public\&workspaceId=a5c25819-937a-4400-8255-41055b6e9de6) to create a workbook in your own account that contains all the Python code you need to connect to Google Sheets.
### Store service account credentials in DataLab
To use the service account credentials JSON in your newly created workbook, you need to store it in DataLab. To do so securely, you can use [Environment variables](/work/environment-variables). In your new workbook, open "Environment > Environment variables..." in the menu bar, and click on "Add". Next:
* Set `Name` to `GOOGLE_JSON`
* Set `Value` to the full contents of the service account JSON file that was downloaded. You can do this by opening the JSON file, selecting all, copying it to your clipboard, and then pasting it in the Value field.
* Set the “Environment Variable Set Name” to “Google Service Account” (this can be anything, really)
Set up GOOGLE_JSON environment variable
After filling in all fields, click “Create,” “Next,” and finally, “Connect.” Your workbook session will restart, and `GOOGLE_JSON` will now be available as an environment variable in your workbook.
If you want to reuse the same services account credentials in another workbook, you don’t need to set up the environment variable again: you can connect the environment variable to your other workspaces as well.
### Read from Google Sheets and write back to Google Sheets
Use the Python code snippets in the workbook that you can create from [this link](https://app.datacamp.com/workspace/new?_tag=workspace\&title=Connect%20to%20Google%20Sheets\&accountType=personal\&utm_content=copy_duplicate_link\&utm_medium=in_product\&utm_source=workspace\&visibility=public\&workspaceId=a5c25819-937a-4400-8255-41055b6e9de6) to install the necessary packages, read data from the Google spreadsheet, analyze it and write data back to the Google spreadsheet. All from Python!
# MariaDB
## Create MariaDB Integration
When inside a workbook, click **View** > **Databases**, then click the **+** icon and follow the on-screen instructions.

For detailed instructions, see [Connect your data to DataLab](/connect-to-data/connect-your-data-to-workspace).
If you want to experiment with MariaDB without setting up a connection, you can use our sample database containing with World Nations data ([source](https://www.mariadbtutorial.com/getting-started/mariadb-sample-database/)).
## Query the database
You can now query the MariaDB database with a [SQL cell](/work/sql-cell). Select it in the **Select source** dropdown in the top left corner of a SQL cell, or select the sample MariaDB database.

###
# Microsoft SQL Server
## Create Microsoft SQL Server Integration
When inside a workbook, click **View** > **Databases**, then click the **+** icon and follow the on-screen instructions.

For detailed instructions, see [Connect your data to DataLab](/connect-to-data/connect-your-data-to-workspace).
If you want to experiment with SQL Server without setting up a connection, you can use our sample database with Bicycle Sales data ([source](https://www.sqlservertutorial.net/sql-server-sample-database/)).
## Query the database
You can now query the SQL Server database with a [SQL cell](/work/sql-cell). Select it in the **Select source** dropdown in the top left corner of a SQL cell, or select the sample SQL Server database.

###
# MongoDB
To work with data in a MongoDB database, you first need to create a set of [Environment variables](/work/environment-variables) to securely store the connection credentials. Next, you can write some Python code to establish a connection and run queries.
## Store MongoDB credentials
Create a new Python workbook (or duplicate [this workbook](https://app.datacamp.com/workspace/new?_tag=workspace\&title=Connect%20to%20a%20MongoDB%20database\&accountType=personal\&utm_content=copy_duplicate_link\&utm_medium=in_product\&utm_source=workspace\&visibility=public\&workspaceId=b00c0e1a-d0c0-4f7f-a6c9-592dd6143fd8) that already has all the Python code you'll need in the next step).
In your new workbook, click on "Environment", and click on "+" next to "Environment variables". You need to create 3 environment variables:
* `MONGO_HOST`: Where your MongoDB cluster/database is hosted, e.g. test-cluster.t6rcsje.mongodb.net.
* `MONGO_USER`: The username with which to connect to your MongoDB cluster
* `MONGO_PASS`: The username's password.
Give a meaningful name to this set of Environment variables, e.g. "MongoDB Cluster". Click Save and continue until your session is restarted to activate these environment variables.
Set up environent variables.
## Query the database
Create a new Python cell and include the following code snippet to create a new Mongo client that connects to the database. Notice how the environment variables are fetched from the environment using `os.environ`.
```python
!pip install pymongo
import os
from pymongo.mongo_client import MongoClient
from pymongo.server_api import ServerApi
uri = f'mongodb+srv://{os.environ.get("MONGO_USER")}:{os.environ.get("MONGO_PASS")}@{os.environ.get("MONGO_HOST")}/?retryWrites=true&w=majority'
# Create a new client and connect to the server
client = MongoClient(uri, server_api=ServerApi('1'))
```
You can now run queries! To start, you can do a ping command to verify that the connection works fine:
```python
try:
client.admin.command('ping')
print("Pinged your deployment. You successfully connected to MongoDB!")
except Exception as e:
print(e)
```
For a quick overview of what PyMongo enables you to do, check out [this comprehensive tutorial](https://api.mongodb.com/python/3.3.1/tutorial.html). It covers how you can get a database, a collection, find documents, insert documents, and more.
### Limit allowed incoming IP addresses
The network calls from the Python or R sessions will always come from one of three fixed, DataCamp-owned IP addresses. You can lock down your MongoDB instance to only accept these IP addresses:
* `34.194.221.107`
* `34.192.118.171`
* `34.192.199.85`
# MotherDuck
## Copy your MotherDuck service token
Follow the steps in [this section ](https://motherduck.com/docs/authenticating-to-motherduck#fetching-the-service-token)of the MotherDuck documentation.
## Set up a MotherDuck connection
When inside a workbook, click **View** > **Databases**, then click the **+** icon and follow the on-screen instructions.
The "Database Name" configuration is optional. If you configure it, the connection will by default connect to that database, but other databases are still accessible.
## Query the database
You can now query your MotherDuck database with a [SQL cell](/work/sql-cell). Select it in the **Select source** dropdown in the top left corner of a SQL cell.
# MySQL
## Set up a MySQL connection
When inside a workbook, click **View** > **Databases**, then click the **+** icon and follow the on-screen instructions.

For detailed instructions, see [Connect your data to DataLab](/connect-to-data/connect-your-data-to-workspace).
If you want to experiment with MySQL without setting up a connection, you can use our sample database with employees data ([source](https://dev.mysql.com/doc/employee/en/)).
## Query the database
You can now query your MySQL database with a [SQL cell](/work/sql-cell). Select it in the **Select source** dropdown in the top left corner of a SQL cell, or select the sample MySQL database.

###
# Oracle Database
## Create Oracle Database Integration
When inside a workbook, click **View** > **Databases**, then click the **+** icon and follow the on-screen instructions.

For detailed instructions, see [Connect your data to DataLab](/connect-to-data/connect-your-data-to-workspace).
If you want to experiment with Oracle Database without setting up a connection, you can use our sample database containing computer hardware data ([source](https://www.oracletutorial.com/getting-started/oracle-sample-database/)).
## Query the database
You can now query the Oracle database with a [SQL cell](/work/sql-cell). Select it in the **Select source** dropdown in the top left corner of a SQL cell, or select the sample Oracle Database connection.

###
# PostgreSQL
## Set up a PostgreSQL connection
When inside a workbook, click **View** > **Databases**, then click the **+** icon and follow the on-screen instructions.

For detailed instructions, see [Connect your data to DataLab](/connect-to-data/connect-your-data-to-workspace).
If you want to experiment with PostgreSQL without setting up a connection, you can use our sample database with Lego data ([source](https://rebrickable.com/downloads/)).
## Query a PostgreSQL database
You can now query your PostgreSQL database with a [SQL cell](/work/sql-cell). Select it in the **Select source** dropdown in the top left corner of a SQL cell, or select the sample PostgreSQL database.
Example of a SQL cell using the Lego sample database connection. The query result is available as df.
###
# Redshift
## Set up a Redshift connection
When inside a workbook, click **View** > **Databases**, then click the **+** icon and follow the on-screen instructions.

For detailed instructions, see [Connect your data to DataLab](/connect-to-data/connect-your-data-to-workspace).
If you want to experiment with Redshift without setting up a connection, you can use our sample data warehouse with online ticket sales data ([source](https://docs.aws.amazon.com/redshift/latest/dg/c_sampledb.html)).
## Query the database
You can now query the Redshift data warehouse with a [SQL cell](/work/sql-cell). Select it in the **Select source** dropdown in the top left corner of a SQL cell, or select the sample Redshift data warehouse.

###
# Snowflake
## Set up a Snowflake connection
When inside a workbook, click **View** > **Databases**, then click the **+** icon and follow the on-screen instructions.
To find your account name, follow [these instructions](https://docs.snowflake.com/en/user-guide/admin-account-identifier). Note that in some cases, it's necessary to [include your cloud region in the identifier](https://docs.snowflake.com/en/user-guide/admin-account-identifier#format-2-legacy-account-locator-in-a-region).
Create a Snowflake connection
For detailed instructions, see [Connect your data to DataLab](/connect-to-data/connect-your-data-to-workspace).
If you want to experiment with Snowflake without setting up a connection, you can use our sample data warehouse with London Public Transit data.
## Query the database
You can now query the Snowflake data warehouse with a [SQL cell](/work/sql-cell). Select it in the **Select source** dropdown in the top left corner of a SQL cell, or select the sample Snowflake database.
Example of a SQL cell using the London Public Transport connection. The query result is available as TFL_JOURNEYS.
# Supabase
This article covers all the required steps to to connect to and query a [Supabase](https://supabase.com) Postgres database through DataLab. This enables you to:
* Analyze the data in the Supabase database, like user growth or daily number of sessions. Which data or processes you want to analyze will depend on the application that Supabase is powering.
* Automate reporting: you can use the "Schedule run" functionality to rerun your analysis on a schedule so that your report always takes in the latest available data as your app is being used.
The steps below and some sample code are also available in [this workbook](https://app.datacamp.com/workspace/w/5ee6687a-5fb6-46aa-af4b-caaf77394b99/edit) (click [this link](https://app.datacamp.com/workspace/new?_tag=workspace\&title=Connect%20to%20Supabase\&accountType=personal\&utm_content=copy_duplicate_link\&utm_medium=in_product\&utm_source=workspace\&visibility=private\&workspaceId=5ee6687a-5fb6-46aa-af4b-caaf77394b99) to create your own copy).
### Setup
#### Create a supabase project
If you don't have a Supabase project yet, go to \[supabase.com]\(, create a free account, start a new project, and follow all the instructions. When setting a database password, make sure to store it somewhere, as you'll need to use this in the next step.
#### Locate your database credentials
Every Supabase project is powered by a Postgres database. To find the credentails of this database, from the Supabase dashboard, click the cog icon ("Settings") and select "Database". You'll see all the credentials you need:
Locate your Supabase Postgres database credentails
#### **Connect to the database**
In DataLab, head over to [your databases overview](https://app.datacamp.com/workspace/databases), click "Connect a database" and select "Postgres".
Configure the connection:
* Database connection name can be anything; give it a meaningful name.
* Hostname, port, database and username: copy these over from the credentials you found in Supabase in the previous step.
* Password: Set this to the password that you provided when setting up the Supabase project in the first step.
* Make sure to check "Encrypt connection".
Click "Connect".
Set up Supabase postgres database connection credentials in DataLab
You're all set now!!
### Query your Supabase data
* Create a new workbook.
* Add a [SQL cell](/work/sql-cell), select the Supabase database connection that you created.
* Write and execute a query, e.g. `SELECT * FROM auth.sessions`
Write and execute a query through a SQL cell
### Further reading
For a deeper dive on Supabase, check out its [documentation](https://supabase.com/docs).
# Publish a notebook
{% hint style="warning" %}
Publishing a notebook is only possible for certification practical exams and competitions.
{% endhint %}
### Publish a notebook
To publish a notebook:
1. Open your workbook.
2. Click the **Publish** button in the left-hand sidebar.
3. Select the notebook file you want to publish.
4. Click **Publish**.
Opening up the publish panel
There are two publishing 'modes':
* By default, your notebook will be run from top to bottom before publishing. This ensures full reproducibility, i.e. all cells run without error and the outputs are the result of executing the notebook in order.
* If you're not worried about reproducibility (you just want to fix some typos or styles, for example), you can switch the "run notebook from top to bottom" toggle off before clicking Publish. A snapshot of your current notebook is taken and turned into a publication quasi-instantly.
### Viewing your published notebook
Publish panel when notebook was published successfully
If publishing was successful, your published notebook will become available through a unique link that you can visit by clicking "Open live publication" (shown above). This is also how others will see your published notebook.
### Who can see my published notebook?
To determine who can view your publication, the permissions on your workbook are followed.
* If your workbook is private to you and shared with no-one, only you can see this published notebook.
* If your workbook is only shared with specific people, only those people will be able to view your published notebook.
* If your group workbook is shared with an entire group, only the members in that group will be able to view the published notebook.
* If your workbook is public, your published notebook can be viewed by anyone.
### Hiding cells in a published notebook
When you publish, by default all the cells of your notebook will be included. If you would like to hide certain cells (such as package installs or pieces of code that are not relevant to your readers), you can follow the steps in [Hiding and showing cells](/work/hiding-and-showing-cells).
### Resolving errors
If an error was encountered in your code while rerunning your notebook, publishing will fail. In the Publishing pane, you can click *View errors* to see exactly what went wrong so you can correct your notebook and try again.
{% hint style="warning" %}
Special care is needed when both of the below are true:
* Your notebook uses additional packages on top of the packages that are available in DataLab by default.
* You're publishing with the 'Run notebook from top to bottom' option enabled.
In this case, you should make sure to install these additional packages **at the top of your notebook**.
This is necessary because publishing happens in a brand-new session, that no longer has your additional packages available. If you do the installs at the top of the notebook, these installs happen again as the first step, after which the rest of the notebook is executed.
Read [Working with packages](/work/code-cell/packages)to learn more about how to install and use additional packages in your notebook.
{% endhint %}
### One publication per workbook
For every workbook, you can only create a single publication. It is currently not possible to publish two notebooks from the same workbook. If you have more than one notebook in your workbook, you'll be able to select which notebook you want to publish.
### Updating a published workbook
If you made changes to your notebook after publishing, these changes are not automatically reflected in the published notebook. For the changes to ripple through to your publication, open up the publish pane again and hit the "Update" button. The published notebook URL as well as its sharing settings are preserved.
###
# Importing data from flat files
DataLab features a [library of curated datasets](https://app.datacamp.com/workspace/datasets) ready for you to analyze, but it is also possible to work with your own data files, be it CSV, Excel, text, geospatial, etc. data files. In this article, we'll assume that the data file you want to work with in DataLab is on your computer. The first step is uploading the file to DataLab, the next step is loading the data file into your notebook session.
### Uploading the data file
* Click on "File > show workbook files" in the menu.
* To upload the data file, you have several options:
* Click on "Add" in the top right of the file browser pane and click "Upload". Select the file from your local filesystem and confirm.
* Click on "Browse files" in the dashed rectangular box in the file browser. Select the file from your local filesystem and confirm.
* Drag the file from a file browser (Windows) or Finder (Mac) window into the file browser pane.
### Loading the data file into your notebook session
Now that you have uploaded to file to your workbook, you can load it into your session so you can start analyzing it.
First, copy the file path to your clipboard: in the workbook file browser, click the icon next to the data file and click "Copy path to clipboard".
Next, add a new code cell to your notebook file and add one of the following code snippets depending on the file format or the language you're using. Note that you may need to tweak this function call to deal with the specifics of your file (e.g. to skip rows, to specify the column names, etc). Replace `example.csv` with the file path you copied to your clipboard in the first step.
File Type
Python
R
CSV
import pandas as pd pd.read_csv('example.csv')
import readr read_csv('example.csv')
Excel
import pandas as pd pd.read_excel('example.xlsx')
import readxl read_excel('example.xlsx')
Finally, run the code cell. The data contained in the file will now be available as a dataframe `df` that you can start analyzing.
#### Shortcut for CSV files
Specifically for CSV files, there is a faster way: click the icon next to the file you want to import and select "Load as DataFrame". A new code cell will be added to your notebook with the appropriate Python or R code.
"Load as DataFrame" is a quick way to import a CSV file into your notebook
# Resizing plots
Depending on the programming language (R or Python) and visualization package you use, plots you create inside DataLab will appear with different dimensions. This article describes the default behavior for the most common visualization packages and how you can customize it to suit your needs.
## Python
A workbook with the code samples in this article is publicly available [here](https://app.datacamp.com/workspace/w/fec49d15-ff91-4ace-b1a0-a8420c8fb3fd/edit?file=notebook.ipynb).
### Matplotlib and Seaborn
By default, figures will be 6.4 x 4.8 inches. If the output area of a code cell is smaller, the image will be scaled to fit inside it.
You can change the size of a specific plot by including the following code before you create the plot:
```python
from matplotlib.pyplot import figure
figure(figsize=(12, 6))
```
If you want to set a different deafult figure size for all plots you're creating in your notebook, you can include the following snippet at the top of your notebook:
```python
from matplotlib.pyplot import plt
plt.rcParams["figure.figsize"] = (12, 6)
```
### Plotly
For plots generated in Plotly, the width is adjusted to fit the with of the output area of the code section (which adjusts with the width of your viewport). The default height is 450 pixels.
You can override these defaults using the `width` and `height` arguments:
## R
A workbook with the code samples in this article is publicy available [here](https://app.datacamp.com/workspace/w/d978e7cb-1029-42df-abde-a04dc1226051/edit?file=notebook.ipynb).
### Base plotting and ggplot2
By default plots will be 7 x 7 inches, with a resolution of 120 dots per inch:
You can control this by setting `repr.plot` options. Note that, once called, these options will be used for all plots you generate from that point on.
### Plotly
For plots generated in Plotly, the width is adjusted to fit the with of the output area of the code section (which adjusts with the width of your viewport). The default height is 450 pixels.
You can override these defaults using the `width` and `height` arguments:
# Show Bokeh and Pyvis plots
DataLab supports most visualisation libraries available for Python and R like [matplotlib](https://matplotlib.org/stable/index.html) and [plotly](https://plotly.com/python/). Some visualisation libraries require special attention to correctly generate output in DataLab.
### Python
#### Bokeh ([docs](https://docs.bokeh.org/en/latest/))
DataLab does not natively support outputs from Bokeh. The guide outlined in the [Bokeh docs](https://docs.bokeh.org/en/latest/docs/user_guide/output/jupyter.html#classic-notebooks) for Jupyter notebooks is not supported. In DataLab it is required to generate a HTML output. You can use the following helper function to display a Bokeh graph:
```python
from IPython.display import HTML
from bokeh.embed import file_html
from bokeh.resources import CDN
def display_bokeh(bokeh_figure):
return HTML(file_html(bokeh_figure, CDN))
```
#### Pyvis ([docs](https://pyvis.readthedocs.io/en/latest/index.html))
Pyvis writes outputs to HTML files. The following example contains a helper function `display_pyvis` which takes a pyvis graph and a name as arguments and will return the HTML output of the graph.
```python
# IMPORTS
from IPython.display import HTML
from pyvis import network as net
import networkx as nx
def display_pyvis(pyvis_graph, name):
filename = f"{name}.html"
pyvis_graph.save_graph(filename)
return HTML(filename=filename)
g = net.Network(notebook=True, cdn_resources='in_line')
nxg = nx.complete_graph(5)
g.from_nx(nxg)
display_pyvis(g, "pyvis-example")
```
# Pricing
An overview of the different pricing plans can be found on [DataCamp's pricing page](https://www.datacamp.com/pricing?tab=workspace).
DataLab offers four plans, one of which is a totally free plan that allows you to use DataLab for free indefinitely.
## Starter
The free offering for DataCamp learners looking to take the next step in their learning. Starter allows you to:
* Create and edit **three** public or private workbooks. You can invite other users as editors to your workbooks and collaborate with them in real-time.
* Run code with 4GB of RAM, a minimum of **0.5 vCPUs** and a maximum of **2 vCPUs**. In order to make use of the full 2 cores, your code needs to be parallellizable.
* Work as long as you want, provided you're not abusing the computation resources available to you (e.g. crypto mining). Your session will be **closed after 30 minutes of inactivity** (no cells running, no notebook edits). For security reasons, your **session will be closed after 6 hours regardless of activity**. In both cases, you can restart your session to continue using DataLab. For more information on running code for an extended period of time, see [Long-running cells](/work/long-running-cells).
* Access databases through fixed IP addresses so you can selectively configure your database's firewall.
* Review and revert to previous notebook versions up to 30 days in the past.
* Prompt the AI Assistant 20 times.
* Store up to 5GB worth of files in a single workbook.
## Premium
A paid offering for individual users with a need for more speed and memory or who want to have private workbooks. Premium enables you to:
* Create and edit **an unlimited** amount of public or private workbooks in your personal space. You can invite other users as editors to your workbook and collaborate with them in real-time.
* Run code with 16GB of RAM, a minimum of **2 vCPUs** and a maximum of **8 vCPUs**. In order to make use of all those cores, your code needs to be parallellizable.
* Work as long as you want, provided you're not abusing the computation resources available to you (e.g. crypto mining). Your session will be **closed after 2 hours of inactivity** (no cells running, no notebook edits). For security reasons, your **session will be closed after 24 hours regardless of activity**. In both cases, you can restart your session to continue using DataLab. For more information on running code for an extended period of time, see [Long-running cells](/work/long-running-cells).
* Access databases through fixed IP addresses so you can selectively configure your database's firewall.
* Review and revert to previous notebook versions up to 1 year in the past.
* Prompt the AI Assistant as often as you want.
* Store up to 20GB worth of files in a single workbook.
## Premium for Groups
A paid offering for for organizations looking to collaboratively work on science projects.
Group members with a DataLab Premium license can:
* Create and edit an unlimited number of **workbooks in your group space**. These workbooks can be **easily shared with the entire group**, rather than having to invite individual people one by one.
* Create and edit group-owned integrations to connect to data warehouses and databases. These integrations are available in all of the group's workbooks.
* Run code with 16GB of RAM, a minimum of **2 vCPUs** and a maximum of **8 vCPUs**. In order to make use of all those cores, your code needs to be parallellizable.
* Work as long as you want, provided you're not abusing the computation resources available to you (e.g. crypto mining). Your session will be **closed after 2 hours of inactivity** (no cells running, no notebook edits). For security reasons, your **session will be closed after 24 hours regardless of activity**. In both cases, you can restart your session to continue using DataLab. For more information on running code for an extended period of time, see [Long-running cells](/work/long-running-cells).
* Access databases through fixed IP addresses so you can selectively open up your database's firewall.
* Review and revert to previous notebook versions up to 1 year in the past.
* Prompt the AI Assistant as often as you want.
* Store up to 20GB worth of files in a single workbook.
Group members without a DataLab Premium license can only create three workbooks. They can edit workbooks created by other members in the group.
To learn more about the difference between personal and group integrations, read [Connect your data to DataLab](/connect-to-data/connect-your-data-to-workspace#personal-and-group-integrations).
{% hint style="info" %}
All groups that applied for DataCamp for Classrooms or DataCamp Donates are on the Premium plan and every member of the group has a Premium license with basic hardware (2 vCPUs and 4GB RAM) for free. If you're new to DataCamp and believe you're eligible for one of these programs, check out [DataCamp for Classrooms](https://www.datacamp.com/groups/classrooms) and [DataCamp Donates](https://www.datacamp.com/donates).
{% endhint %}
## For **Organization Learning & Development**
Maximize organizational learning with a [fully-configured and secure sandbox environment](/resources/manage-group-settings#with-full-capabilities-or-in-restricted-mode) for data experimentation. Contact sales for pricing.
* A controlled learning environment
* Unlimited group workbooks
* Dedicated Customer Success Manager
## FAQ
**What's a vCPU?**
When you run code on DataLab, you run this code in an isolated environment on one of DataCamp-managed cloud servers that you share with other users. Typically, 8 to 16 users are using the same physical server. To ensure every user gets a fair share of the processing power available on the server, every user gets a type of 'budget', which is expressed as a number of vCPUs, short for virtual CPUs. If the CPU resources of the server are 'contended' (because everyone on that server is doing a lot of heavy computation at the same time), users on paid plans will get 4 times more 'budget' on the CPU resources. In this situation, if CPU resources are contended and if the code is parallellizable to make full use of all CPU cores, the code of a user on DataLab Premium or with a DataLab Premium for Groups license will finish 4 times faster.
**What if I run out of a disk quota in my workbook?**
Every workbook has a maximum filesystem size of 5GB. If you run out of free storage, you are no longer able to edit or access your project. Contact us and we'll solve it for you.
**Can I run multiple workbooks at the same time?**
Yes! You can have at most 5 workbooks open at the same time, active and executing code in different browser tabs.
# Manage group settings
Group admins can configure how members of their group can use DataLab. Other than billing and license assignment, there are three aspects that can be managed through the general settings tab in the group admin settings, i.e. /settings.
## With full capabilities or in Restricted Mode
For groups that subscribed to DataCamp through the website, DataLab runs with **full capabilities**: as an open platform, allowing users to upload custom datasets, connect to external data sources, install additional Python or R packages, and share their work with the world.
Users that are only in groups that run with full capabilities, can:
* Create, rename and delete workbooks.
* Upload and download files
* Execute code and scripts (R, Python, SQL, Bash).
* Share a workbook with other DataCamp users.
* Install additional Python or R packages from GitHub, PyPi, CRAN, etc.
* Access remote data sources and APIs through integrations.
* Securely store secrets as environment variables.
For groups that purchased DataCamp through DataCamp's sales and customer success organization, DataCamp runs in **“Restricted Mode”**.
Users that are in one or more groups with Restricted Mode enabled, can:
* Work only with pre-approved datasets, databases, and packages
* Contact your Customer Success Manager for enabling your own [Data Sources](/connect-to-data/connect-your-data-to-workspace) in Restricted Mode
* Collaborate with group members only.
* **not** upload files from their local file system
* **not** set up new database connections
* **not** access remote servers
* **not** install new packages
* **not** create publicly available workbooks
* **not** share work with people outside of the organization
* **not** access workbooks in groups that run with full capabilities.
For more details on Restricted Mode and switching modes, please contact support or your Customer Success Manager.
## Access to AI assistant
DataLab features an AI assistant that lets users generate code based on prompts or explain and fix errors. This functionality is powered by large language models by OpenAI.
Group admins can toggle access to the AI Assistant:
Group admins can toggle access to the AI Assistant.
## Default group access
By default, newly created group workbooks will be private to the group member that created the workbooks. Group admins can change this, so that newly created workbooks are immediately accessible by other group members with viewer, commenter or editor permissions:
Group admins can specify the default workbook access
## Control sharing permissions
By default, group members can share workbooks they create with the entire group or specific other group members, either as viewer, commenter or editor. Group admins can restrict these sharing capabilities, to disable sharing with the entire group, sharing with specific users or both. This can be useful e.g. in a context that workbook is used in an assessment/assignment/exam context.
Group admins can restrict the ability of group members to share their workbooks with the group or specific users
\
# Reporting for Group Admins
This page outlines DataLab usage reporting options available to Enterprise Group Admins.
### DataLab Insights
Admins can view insights into their organization's usage by visiting the **DataLab Insights** section of Group Hub.
You can find this by navigating to the **Insights & Analytics** section in the left navigation menu and clicking **Reporting**. In the displayed window, click **Custom Reports** from the top navigation. Select **DataLab Insights** from the available options.
### Available Data Points
* Number of DataLab Sessions by User & Group
* Time Spent Per User in DataLab by User & Group
* Workbook Details by User & Group: Title, Language, Workbook Source, Size, Publish Dates,
* Number of Workbook Shares
* Number of Workbook Upvotes
### Exporting Data Data Connectors
All DataLab Insights data can be imported to a customer's preferred database so they can build their own reports. Customers can access those tables via Data Connector to build their own DataLab reporting. You can find more technical information here:
* [Using the Data Connector](https://enterprise-docs.datacamp.com/data-connector/using-the-data-connector)
* [DataLab Reporting Tables](https://enterprise-docs.datacamp.com/data-connector/explore-data-model/data-model#datalab)
# DataLab for education
DataLab is the perfect tool to power your data science and analytics teaching, be it in academia or in companies. In this article, we describe how DataLab can support some typical education use cases.
For these use cases to work well, companies will require a DataLab Premium for Groups subscription, so they can create multiple team workbooks. Academic and DataCamp Donates groups get this DataLab Premium plan for free! Check out [Pricing](/resources/pricing) for more information on DataLab plans.
## Use DataLab for individual and team assignments
Teachers and subject matter experts can use DataLab to build capstone projects and assignments to verify that learners can apply data skills in a real-world setting.
#### **Configuring the assignment**
* Switch to your group account context by clicking the dropdown in the sidebar:\

* Create a new workbook ([example](https://app.datacamp.com/workspace/w/67f72e14-c3b2-494f-8660-afa24cd0ef8d/edit)) that contains the sample notebooks that your students are required to complete.
* In the editor toolbar, open the **File** menu and choose **Create copy link...**
* Configure the settings for the workbooks that will be created using the link. Click on **Create Copy Link**. This will copy a duplication link ([example](https://app.datacamp.com/workspace/new?_tag=workspace\&title=Analyze%20unicorn%20funding%20vs%20valuation\&accountType=personal\&utm_content=copy_duplicate_link\&utm_medium=in_product\&utm_source=workspace\&visibility=public\&workspaceId=67f72e14-c3b2-494f-8660-afa24cd0ef8d)) to your clipboard.
* Share the link with your students (through email, your institution's LMS, your company's communication channels).
#### Starting the assignment
If a participant of the assignment clicks the link ([example](https://app.datacamp.com/workspace/new?_tag=workspace\&title=Analyze%20unicorn%20funding%20vs%20valuation\&accountType=personal\&utm_content=copy_duplicate_link\&utm_medium=in_product\&utm_source=workspace\&visibility=public\&workspaceId=67f72e14-c3b2-494f-8660-afa24cd0ef8d)) that was sent to them:
* They land into a newly created workbook, that contains all of the files of the teacher's 'source workbook', effectively cloning the 'boilerplate' workbook entirely.
* They can now get started on the assignment immediately, with the explanation, data, and all packages preconfigured.
#### Collaborating on the assignment
When participants are supposed to collaborate on the same assignment as a team. Only one of the team's participants should click the copy link, which creates a new workbook. After that, they can click on "Share" and add the other team's participants by adding their email and ensuring they have "Editor" access.
#### Submitting the assignment for review
If a participant is ready for their work to be reviewed, they can share the completed workbook with the teacher again by clicking on "Share" and adding the teacher as a collaborator by adding their email. The participant can choose the rights the teacher has: viewer, commenter or editor.
{% hint style="info" %}
As a group admin (typically the teacher), you can configure the default sharing settings of newly created workbooks inside a group. Learn more [here](/resources/manage-group-settings#default-workspace-access).
{% endhint %}
## Use DataLab for workshops and hackathons
DataLab is the perfect tool to organize data science and analytics workshops. You can consider them as a live variation of the assignment use case explained above:
* A teacher or SME creates a boilerplate workbook and shares the copy link
* Participants can create their own workbook by clicking the copy link
* Participants can collaborate by inviting others as editors to the workbook
* Solutions can be reviewed by others by inviting them as viewers or commenters to the workbook.
For a detailed step-by-step guide on how to organize a hackathon, check out our [dedicated blog article](http://www.datacamp.com/blog/run-data-hackathons-with-data-camp-workspace).
{% hint style="warning" %}
If you're hosting workshops or hackathons where a lot of people will be using DataLab from the same IP address (i.e. the same physical location), DataLab may stop working because our [DDOS protection ](https://developers.cloudflare.com/ddos-protection/)can kick in. If you're planning to host a workshop or hackathon with more than 50 people in the same location, let us know at least a week up front on and we'll make sure everything goes smoothly.
{% endhint %}
# Technical requirements
DataLab will work out of the box, with lots of functionality that is readily available for you in your browser. To securely connect to DataLab, however, you will need to meet certain technical requirements. By default, these are usually met automatically if you use a standard browser on a standard network.
### Browser requirements
In order to have the best experience in DataLab, you should be using any of the following browsers:
* Google Chrome (version 117 or newer)
* Mozilla Firefox (version 117 or newer)
* Safari (version 17 or newer)
* Microsoft Edge (version 117 or newer)
Other browser might also work, but have not been tested thoroughly.
### Network rules
If you are on a managed network, like a company network, it is possible your IT/security specialist has set up some rules to restrict network access from within the network. This can affect your experience on DataCamp. The system requirements of DataCamp as a whole are described in [this](https://support.datacamp.com/hc/en-us/articles/360001541574-DataCamp-System-Requirements#additional-considerations--0-6) support article.
In this article, we want to give a bit more context on the hosts that need to be whitelisted on your network in order to use DataLab specifically:
* `*.datacamp.com`: this is the standard DataCamp domain, used for most of our applications on the web.
* `*.datacamp-workspace.com`: this is a secure domain used by DataLab, in order to let you safely interact with your workbook. By using a separate domain for certain parts of our product, we create a layer of security that makes it impossible for malicious users to perform harmful operations on our platform. **When this domain is not whitelisted, it’s possible that parts of DataLab don’t work**.
# Addressing slow code
DataLab runs on performant servers in the cloud. If you are on DataLab Starter, i.e. the free tier of DataLab, your workbooks gets 0.5 vCPUs and 4GB of RAM. If you are on DataLab Premium, your workbook gets 2 vCPU and 16GB of RAM. For more information on the difference between the different plans, check [Pricing](/resources/pricing).
If the work you're doing is resource intensive, you may experience your code being slow to execute. This article lists the most common cases of code running slowly with suggestions on how you can address them.
### **Plots are slow to generate**
* Try to reduce the amount of data you are plotting, for example, by aggregating over a certain dimension or just taking a sample of the data.
* Some plot types are notoriously resource intensive to generate, for example, swarm plots. Consider another plot type.
### My cell keeps running forever
* Your cell might contain an infinite loop, check for while loops that might have a condition that's never false.
### **Database queries are slow**
* The database you are querying might be slow to respond. In that case, consider restarting the database or making your database server more powerful.
* You may be querying a lot of rows, resulting a large data transfer to your notebook. In that case, you can try a couple of things:
* Make your query more specific so you fetch only the data you need.
* Limit the number of rows returned by your query until you're certain the rows contain the data you need, and only then perform a query without a limit.
* If you want to aggregate the result of the query, consider doing the aggregation in SQL rather than in Python, so a lot of computation already happens on the database.
### **Machine learning models are slow to train**
* Some machine learning models benefit from GPUs when training. DataLab does not provide GPU machines yet. As an alternative, you can train the model on your own computer and then upload the trained weights to your workbook.
* If you're on DataLab Starter and your workload can be paralllellized, consider upgrading to DataLab Premium to use more vCPUs for the training.
# Address R vulnerability
On April 29, 2024, security researchers discovered a vulnerability that affects version 4.3 (and earlier) of the R programming language. The vulnerability allows a threat actor to arbitrarily execute code on targeted devices. The full details are [here](https://kb.cert.org/vuls/id/238194).
This vulnerability is solved in R version 4.4, which is available on DataLab. You are strongly advised to upgrade the R version of workbooks you’re actively using from R version 4.2 to R version 4.4.
### Steps to upgrade the R version in your workbooks
To adjust the settings of a workbook to use R version 4.4 instead of R version 4.2:
* Visit [www.datacamp.com/datalab](http://www.datacamp.com/datalab) (and sign in with your DataCamp account if needed)
* Open a workbook that you still plan to work on in the future.\

* Ensure you’re in the ‘Code’ view (you can find the toggle in the top-right corner)\

* Open the ‘Environment’ tab and select R 4.4 from the Session details dropdown\

Repeat the steps above for every R workbook you plan to use regularly.
### We're here to help
If you have any questions or need assistance regarding this change, please [Get help](/resources/support).
# Get help
Reach out for any suggestions or questions
If you're encountering issues, you can report this in-app:
* On the [dashboard](https://app.datacamp.com/workspace/overview), click "Report an issue" at the bottom of the sidebar\

* When editing a workbook, click Help in the menu bar, followed by "Report an issue".\
A box will appear where you can describe your problem.
In the background a support ticket will be created with some information about your system attached to help us debug. A support representative will reach out to get your issue resolved.